
REIT Total Return: Heading into 2023
Happy New Year!
It is a time of reflection and self-improvement. In that spirit, we want to take some time to examine the history of 2nd Market Capital’s REIT Total Return Portfolio (RTR) since its inception on 7/1/16 as well as a deeper dive into what happened in 2022.
In knowing the history, we can gain some insight as to where the portfolio and REITs as a whole are headed going forward.
Performance
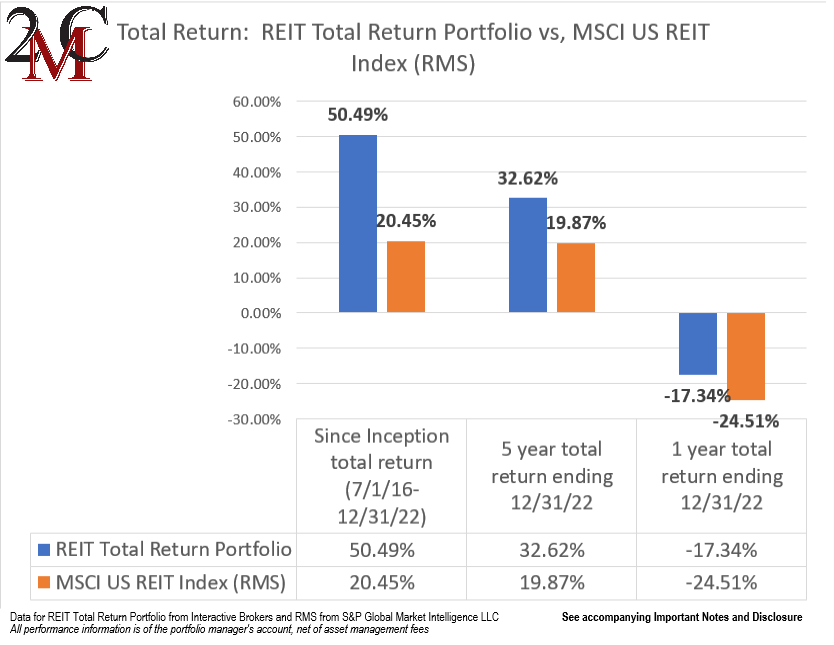
I don’t think we have ever felt so unfulfilled by 3000 basis points of alpha. Since inception (7/1/16 through 12/31/22), REIT Total Return Portfolio returned 50.49% while the REIT index (RMS) returned 20.45% over that same time period. Again in 2022, we outperformed by losing 17.34% while the REIT index lost 24.51%.
At the risk of tooting our own horn, this level of outperformance is quite uncommon in the industry, and we will do everything in our power to keep it going.
Yet at the same time, it doesn’t feel all that good. There is a saying on Wall Street that goes “You can’t eat Alpha”.
The idea being that relative performance alone does not actually put food on the table. At some point, it comes down to absolute performance.
Translation of relative performance into absolute
In the long run, losing by less matters just as much as winning by more.
Trudging through the hard times with a moderate positive return is a key part of our long run process. If one can outperform during the bad times and again during the good times, the net result is quite good. It becomes a test of equanimity and patience to stick with a strategy through the hard times. It helps to have knowledge of market history to know that downturns are almost invariably followed by bounces.
REITs are not alone in having a rough period. In fact, the S&P went through something significantly bleaker than the 20% the REIT index returned over the last 6.5 years.
From 12/31/1999 – 12/31/2010, the S&P went through what has been termed the “lost decade”. Over that 11-year period, the S&P generated an annualized total return of -0.9%.
That must have been brutal to invest through, but as we know today, it was not the end for the S&P. During that period stocks got massively cheaper which spring-loaded them for excellent forward returns. Indeed, the S&P performed great since 2010.
we think REITs are in a similar situation right now. The index’s 20% return is less than the dividends over that 6.5-year period meaning that market prices are actually down.
we find this curious as real estate values are up approximately 50% since 2016.

How can we reconcile negative market price movement with a 50% increase in asset value?
We see 2 possible explanations:
- Asset values are inflated and will come down to match market prices
- Market prices are too low and will rise to match asset values.
The correct explanation boils down to whether or not commercial real estate prices should have gone up 50%. Are real estate buyers overpaying or has real estate legitimately increased in value?
Well, one of the most concrete measures of real estate value is replacement cost because it is not based on the sentiment of a buyer and therefore removes much of the cyclicality. It is a simple measure of the actual cost to produce a new building.
Since 2016, commercial real estate construction costs have risen by about 60%.

Thus, we believe the 50% increase in real estate value over that time period is fully grounded in reality. Buildings are worth more because they cost more to create. Any real estate, whether owned or rented has to compete with the substitute of just building fresh. As such, the value of standing real estate correlates strongly with construction cost via a causal link.
The long run
REITs have historically generated a roughly 9%-11% annual return over very long time periods. Their return is slightly above that of the S&P, but basically in line.
On a tactical basis, however, we think REITs are set up for some years of outperformance. Just as the S&P shot up in the decade following the lost decade, REITs are poised to do the same.
- REITs are trading well below net asset value
- Construction activity has been somewhat light resulting in moderate undersupply of real estate across many sectors.
- FFO multiples are fairly low.
So while REITs as a whole look to be in a good place, we think there are ways to better position within REITs. Overall, I think we have 4 key advantages relative to the REIT index.
Advantage #1 Lower Price to FFO multiple (10.9X compared to 14.18 for index)
In our opinion, investors too frequently look at the dividend yield as a proxy for expected return. A much better proxy is FFO yield. There is a huge difference between a 5% yielding stock with a 100% payout ratio and a 5% yielding stock with a 50% payout ratio.
The lower payout ratio affords reinvestment of excess cashflow into growth. Thus, all else equal, the lower payout ratio stock will have faster dividend growth going forward.
Here at Portfolio Income Solutions, growing the cashflow generation of the portfolio is what we care about. Whether that cash is paid out as dividends or retained for growth is only a secondary concern.
RTR has an FFO yield of 9.13% compared to 7.05% of the REIT index.

It so happens that we have a higher dividend yield at 5.65%, but that is merely a result of it being fueled by the higher cashflow yield.
Advantage #2: More diversified
While the REIT index contains about 170 stocks, they are concentrated primarily in just a handful of property buckets. This is the folly of market cap weighting which we have previously discussed in more detail, but the main issue with the index is that it has virtually no exposure to some of the smaller sectors which, from a real estate perspective, are key areas.
We take a more moderate weight to a wide variety of sectors.
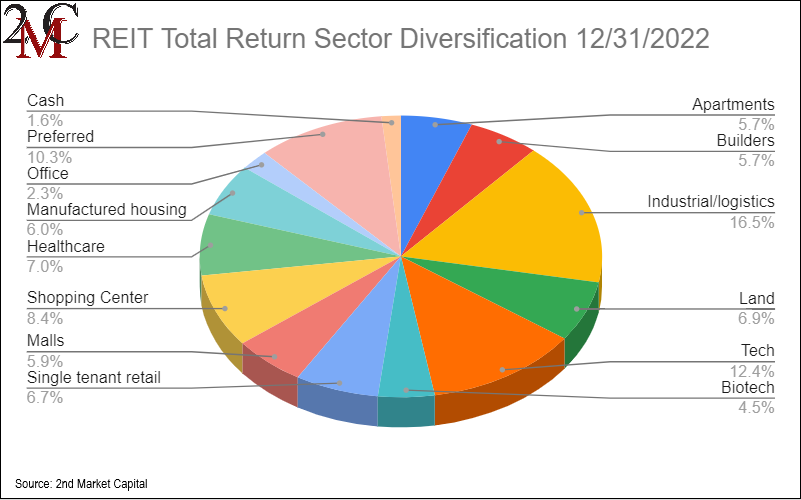
Advantage #3: Overweighting the strength
Farmland, manufactured housing, and biotech labs barely exist in the index, but the fundamentals are great. They are some of the fastest growing sectors, so we have heavily overweighted them in RTR.
Advantage #4: Avoiding the bad
Investing is a positive sum game. The overall market tends to go up, faster in some periods and slower in others, but overwhelmingly a positive trajectory. Thus, the basic investment is good.
There is some value to be gleaned in finding the even better stocks and we certainly attempt to do that, but the most clearcut way to outperform is to simply avoid the obviously bad stuff. It comes in many forms but the common sources of failure in REITs are as follows:
- Misaligned management
- Non-viable business model
- Overcompensation of management
- Severe oversupply of a property type
- Property type obsolescence
- Extreme overvaluation
There are multiple REITs in each of these categories. We estimate there are roughly 25 clearly bad REITs at the moment. Avoiding these is a huge leg up over the index.
2022
When discussing what happened in 2022, many will say things like the entire market got clobbered. While largely true, we think taking that a layer deeper will provide insight as to where we want to be positioned heading into 2023. Specifically, being explicit about the separation between price and fundamentals.
In some areas of the market, price and fundamentals moved in tandem while in others they moved in opposite directions. If the market price got clobbered but the fundamentals remained strong or even improved, that is where we want to be. Before we get to the individual stocks and industries, we do think it is worth spending some time understanding what fundamentally changed at an environmental level in 2022.
A profound revaluation
As sick as we are about discussing interest rates, we do think it is crucial to recognize the magnitude of impact. The 10-year treasury yield went from 1.52% to 3.88% over the last year.
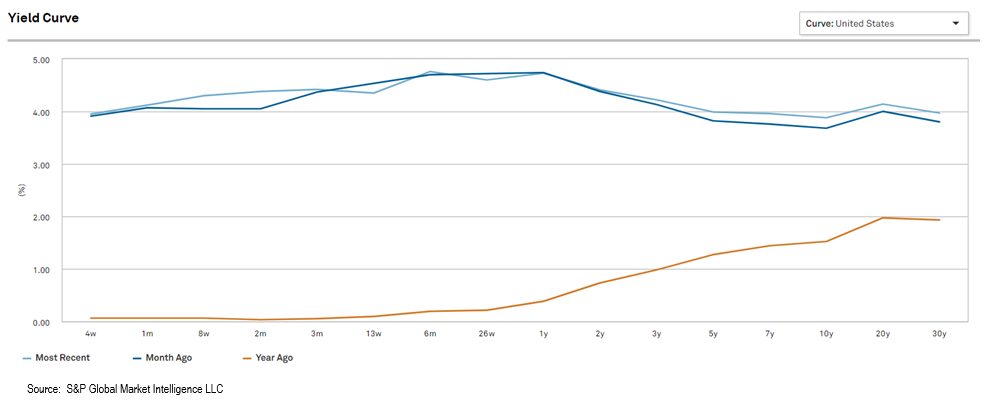
That changes everything in the market. It is not just fear of the Fed or higher interest expense, it is a universal change to expected rates of return.
Everything now has to have a return that is 236 basis points higher (assuming parallel shift).
- If a junk bond was previously worth buying at a 6% yield it now has to have an 8.36% yield.
- If an average risk equity previously had an expected return of 7% it now has to offer an expected return of 9.36%
- If a high-risk equity previously had an expected return of 10% it now must offer 12.36%
That is the nature of the price of everything dropping. Earnings didn’t suddenly shoot up, so the only way to create a higher forward expected return was for the price to drop.
The risk-free rate governs all valuations in finance. As such, the overall market crash in light of the changes to the discount rate is rational. All else equal, the market dropping 20% makes everything 25% higher return going forward.
In academia, this global revaluation happens perfectly and proportionally. In practice, it is sloppy and disproportional.
Today’s great opportunity is finding those pockets of sloppiness. Finding the areas that were disproportionately impacted and taking advantage of the market’s mispricing.
Evolving economies create opportunity
Our REIT Total Return Portfolio is actively managed to pivot into wherever the opportunity is greatest. We are now offering portfolio mirroring in which the trades in our REIT Total Return Portfolio are automatically executed in client portfolios simultaneously and at the same price.
Important Notes and Disclosure
Material Market and Economic Conditions. March 2022-2023: Significant increases in the Federal Funds Rate by the Federal Reserve have caused REIT market prices to decline more than the broader markets. REITs rely on debt financing to acquire properties and fund their operations; expiring lower-cost debt is being refinanced at higher interest rates due to prevailing market conditions. March 2020: REIT Total Return’s value declined substantially as COVID shut down the economy. It recovered in 2021 as the economy reopened. January 2019: Tax-loss selling’s calendar expired and the government reopened on January 25, 2019. The combined effect caused our shares to rise more than the broader markets. December 2018: Another Fed-Funds rate hike, unresolved US-Chinese trade, a partial government shutdown, and an exaggerated tax-loss selling season put extreme downward pressure on equity prices. All of these factors contributed to diminished liquidity and more significant share price declines in small-cap/value issues; REIT Total Return is focused on small-cap/value issues, so our decline was significantly more precipitous.
Material Conditions, Objectives, and Investment Strategies. REIT Total Return is an actively managed investment portfolio of real estate equities, primarily common and preferred shares of REITs, with an aim to generate high total returns from a mix of dividends and capital appreciation.
All REIT Total Return Portfolio performance information on this page is based on the performance of the Portfolio Manager’s account, using the manager’s own funds. Performance of the Portfolio Manager's account is calculated by Interactive Broker on a daily time-weighted basis, including cash, dividends and earnings distributions, and reflects the deduction of broker commissions (when commissions were charged). Actual client returns will differ. **2nd Market Capital’s advisory fees are simulated and applied retroactively to present the portfolio return “net-of-fees”.
None of the performance information displayed on this page is based on the actual performance of any 2MCAC client account investing in this portfolio. The performance in a 2MCAC client account investing in this portfolio may differ (i.e., be lower or higher) from the performance of the account managing this portfolio and portrayed on this page based on a variety of factors, such as trading restrictions imposed by the client (resulting in different account holdings), time of initial investment, amount of investment, frequency and size of cash flows in and out of the client account, applicable brokerage commissions (when commissions were charged), and different corporate actions. Clients investing in this portfolio may view the actual performance of their investment in this portfolio by logging into their Interactive Brokers account and reviewing their customized dashboard.
Clients may restrict any of the securities traded in their account but should note that any restrictions they place on their investments could affect the performance of their account leading it to perform differently, worse or better, than (a) the above-portrayed account or (b) other client accounts invested in the same portfolio.
Forward-looking statements. Commentary may contain forward-looking statements which are by definition uncertain. Actual results may differ materially from our forecasts or estimations, and 2MCAC cannot be held liable for the use of and reliance upon the opinions, estimates, forecasts, and findings in these documents.
Past performance does not guarantee future results. Investing in publicly held securities is speculative and involves risk, including the possible loss of principal. Historical returns should not be used as the primary basis for investment decisions. Although the statements of fact and data in this commentary have been obtained from sources believed to be reliable, 2MCAC does not guarantee their accuracy and assumes no liability or responsibility for any omissions/errors.
Use of Leverage or Margin. REIT Total Return Portfolio will utilize margin only for trading purposes (the ability to use the proceeds from stock sales immediately for new purchases instead of waiting for the usual 2-day settlement period), but not for borrowing purposes.
Benchmark Comparison. Our REIT Total Return Portfolio is compared to the Dow Jones Equity REIT Index and the MSCI U.S. REIT index because they are common REIT Indices. The Dow Jones Equity All REIT Index is designed to measure all publicly traded equity real estate investment trusts (REITs) in the Dow Jones U.S. stock universe. The MSCI US REIT Index is comprised of equity real estate investment trusts (REITs) eligible included within the eight Equity REIT Sub-Industries of the Equity Real Estate Investment Trust (REITs) Industry. It is not possible to invest directly in the Dow Jones Equity All REIT Index or MSCI US REIT index. Index returns do not represent the results of actual trading of investible assets/securities. Index returns do not reflect payment of any sales charges or fees an investor may pay to purchase the securities underlying the index. The imposition of these fees and charges would cause the actual performance of the securities to be lower than the Index performance shown. The results portrayed include dividend income. Our REIT Total Return Portfolio may include REITs that are not eligible for inclusion in the Dow Jones Equity All REIT Index or MSCI US REIT Index.
There can be no assurance that a benchmark will remain appropriate over time and 2MCAC will periodically review the benchmark’s appropriateness and decide to use other benchmarks if appropriate.
Expenses. Returns reflect the deduction of any transaction expenses. REIT Total Return's advisory fees are simulated and applied retroactively to present the portfolio return “net-of-fees”.
Calculation Methodology. Returns are calculated by 2MC with data from Interactive Brokers LLC using the Modified Dietz method, a time-weighted measure of performance in which cash flows are weighted based on their timing. Dividends in REIT Total Return are reinvested.
S&P Global Market Intelligence LLC. Contains copyrighted material distributed under license from S&P.