
Using Pareto Upgrades to Grow Yield on Invested Capital
In less than 2 years, yield on invested capital in our Baseline + accounts has increased from 8.55% to 11.33%. A large portion of this increase came from Pareto upgrades.
What is a Pareto upgrade?
Pareto superiority is an economic concept in which one choice is better in at least one parameter while being at least equal in every other parameter. You get to upgrade in one area without sacrificing in any other area.
Here is a current example:
Arbor Realty (ABR) has multiple preferred issues with slightly different terms. ABR-F floats in October, while ABR-D and ABR-E are fixed-rate.
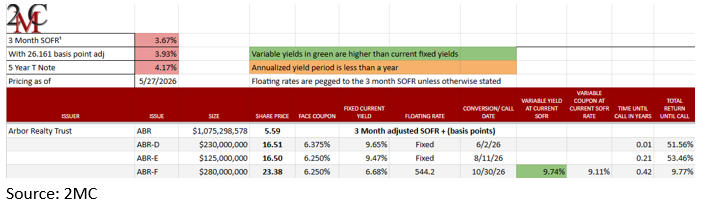
At the exact pricing at the time of the screenshot, ABR-D is clearly better than ABR-E. Its yield of 9.65% is 18 basis points higher than ABR-E’s 9.47%. They are trading at $16.51 and $16.50, respectively, so the upside to par is essentially identical.
Thus, anyone who currently owns ABR-E could upgrade to ABR-D and get an extra 18 basis points of yield without any extra incremental risk.
18 basis points of extra yield on a single issue might not seem like much, but we execute similar maneuvers dozens of times. The key to repeated execution is the disparate and somewhat erratic market pricing of preferreds.
Take a look at the pricing of AGNC Investment Corp (AGNC) preferreds.
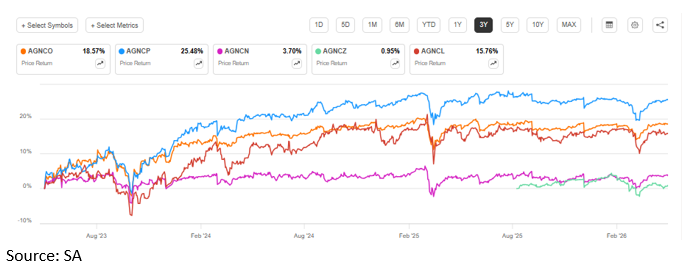
The AGNC preferreds are not quite the same as each other because there are significant differences in their floating rate schedules and terms, but the substantial differences in trading behavior between them have created plenty of opportunities in which one issue was clearly better than the others.
In flipping between the AGNC preferreds as they fluctuate in relative opportunity, one could repeatedly clip basis points of excess yield.
Cumulative impact of Pareto upgrades
Many investors don’t bother with Pareto upgrades because it feels like such a small gain, but the cumulative effect of doing it repeatedly adds up to something very powerful for yield on invested capital.
Each time one gets a Pareto upgrade, it stacks multiplicatively. The individual trades might only add 5 basis points to yield on invested capital, but after doing it again and again, yield on invested capital starts to materially outpace what one would get from simple dividend reinvestment. To illustrate this point, we can look at the actual data from our Baseline + accounts. Yield on invested capital rose from 8.53% in July of 2024 to 11.33% as of the end of April 2026.
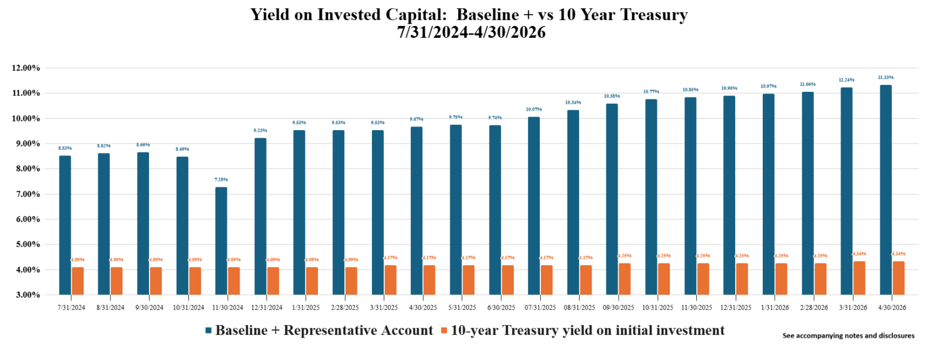
In comparison, investing in a 10-year treasury with just interest reinvestment would have taken yield on invested capital from 4.09% to 4.34% over that same timeframe.
Opportunities are numerous and far reaching. Over the last 12 months, we’ve traded in more than 3 dozen preferred shares and in multiple subsectors. Despite the ubiquity of Pareto upgrade opportunities, the majority of market participants do not bother to look at such a granular level for what appears to be a small gain. Do not underestimate the compounding effect of these small gains. We will continue to grow yield on invested capital.
Find out if our Baseline + accounts are suitable for your goals.
Compounding is Powerful
Get started on compounding your assets by opening a Baseline + account today. Discounts present in today’s market prices afford getting in at a higher dividend yield which essentially provides a faster rate of compounding. We actively manage stock selection to keep accounts invested in current opportunities with strong fundamentals and favorable valuation.
If you’re interested in learning more about our advisory services, please contact Simon Bowler or Dane Bowler:
Simon Bowler
Chief Communication Officer
Dane Bowler
Chief Investment Officer
Important Notes and Disclosure
Material Market and Economic Conditions. 2026: REITs traded mixed as strong fundamentals were offset by rapidly rising rates. Early 2025: REITs stayed relatively stable in the presence of tariff discussions that spooked the broader market. REITs were viewed as relatively isolated from world trade.
Material Conditions, Objectives, and Investment Strategies. Baseline + is an actively managed investment strategy focused on a dividend yield spread over Treasuries and Corporate bonds, investing primarily in discounted preferred and common REIT shares with a goal of capturing capital appreciation.
Unless identified as Hypothetical, all Performance information on this page is based on the Baseline + composite account; the average of all fee and non-fee paying discretionary accounts that are similarly managed, including closed accounts that are part of the period covered. Performance of the discretionary accounts included in the composite is calculated by Interactive Brokers on a daily time-weighted basis, including cash, dividends, and earnings distributions, and reflects the deduction of 2nd Market Capital’s advisory fee to reflect performance net of fees. Actual client returns may differ.
Yield on Invested Capital Chart. Yield on Invested Capital represents the total annual indicated dividend income (or interest) divided by the contributed capital. 2MC Baseline + is a representative account; a portfolio with substantially similar investment policies, objectives, and strategies as those of our Baseline + asset management accounts. The representative account’s capital contribution was $100,000 on 7/02/2024; dividends are reinvested. The 10-year Treasury Note is a benchmark for long-term interest rates and pays interest (not dividends) semi-annually at the rate fixed at purchase. Yield on Invested Capital for the 10-year Treasury represents annual interest income divided by the initial capital contributed invested on 7/2/2024 with assumed pay periods of 9/30/2024, 3/31/2025, 9/30/2025 and every six months, with reinvestment of interest payments. Actual advisory client total return will be impacted by capital gains/losses and reduced by the 1% annual advisory fee. Future dividend yield is subject to change.
The performance in a 2MCAC client account investing in Baseline + may differ (i.e., be lower or higher) from the performance of the representative account portrayed on this page based on a variety of factors, such as trading restrictions imposed by the client (resulting in different account holdings), time of initial investment, amount of investment, frequency and size of cash flows in and out of the client account, and different corporate actions. Clients investing in this portfolio may view the actual performance of their investment in this portfolio by logging into their Interactive Brokers account and reviewing their customized dashboard.
Clients may restrict any of the securities traded in their account, but should note that any restrictions they place on their investments could affect the performance of their account leading it to perform differently, worse or better, than (a) the above-portrayed account or (b) other client accounts invested in the same strategy.
Forward-looking statements. Commentary may contain forward-looking statements which are by definition uncertain. Actual results may differ materially from our forecasts or estimations, and 2MCAC cannot be held liable for the use of and reliance upon the opinions, estimates, forecasts, and findings in these documents.
Past performance does not guarantee future results. Investing in publicly held securities is speculative and involves risk, including the possible loss of principal. Historical returns should not be used as the primary basis for investment decisions. Although the statements of fact and data in this commentary have been obtained from sources believed to be reliable, 2MCAC does not guarantee their accuracy and assumes no liability or responsibility for any omissions/errors.
Use of Leverage or Margin. Baseline + Portfolio will utilize margin only for trading purposes (the ability to use the proceeds from stock sales immediately for new purchases instead of waiting for the usual 1-day settlement period), but not for borrowing purposes.
Expenses. Returns reflect the deduction of advisory fees and any transaction expenses .
Calculation Methodology. Returns are calculated by Interactive Brokers LLC using the Modified Dietz method, a time-weighted measure of performance in which cash flows are weighted based on their timing. Dividends in Baseline + accounts are reinvested.
S&P Global Market Intelligence LLC. Contains copyrighted material distributed under license from S&P