UMH Properties’ Fundamentals Look Strong
UMH Properties (UMH) offers an enticing combination of value and growth. Specifically, it has a greater than 5-year runway of double-digit organic growth, yet it trades at a steep discount to net asset value (NAV). This discount places it at 17.5X forward AFFO, which is far cheaper than other REITs with similar growth profiles.
This report will discuss:
- Fundamentals of manufactured housing (MH) sector
- UMH’s growth pipeline
- What the market is missing in UMH’s value
- AFFO/share trajectory
- Risks to UMH
Manufactured Housing’s unusually long growth cycle
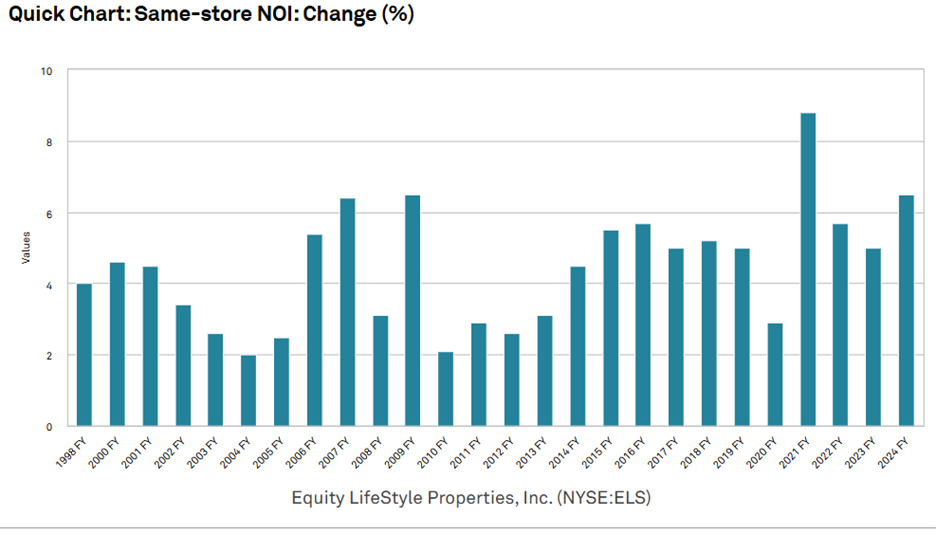
Manufactured housing has had positive same-store net operating income growth for over 27 years in a row. Below is the data from Equity LifeStyle (ELS).
A similar streak is present at Sun Communities (SUI).
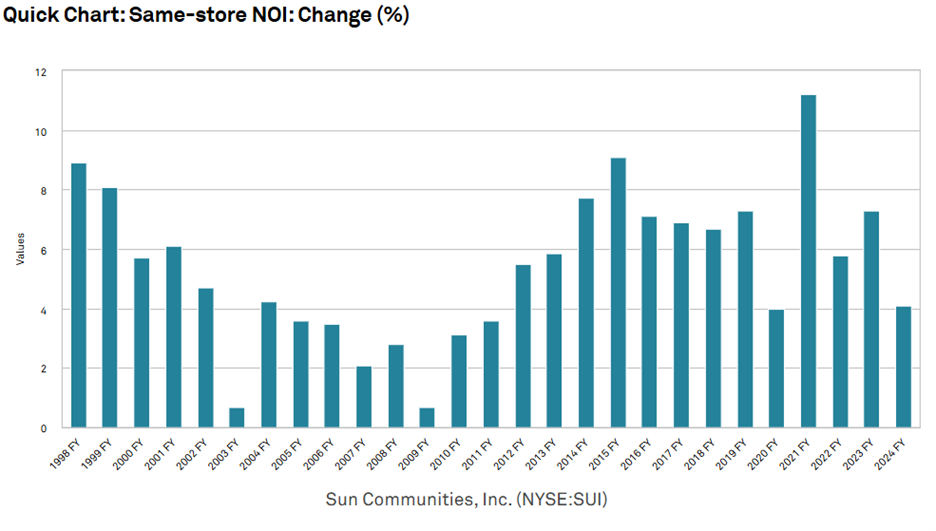
We believe the streak is actually longer than that, but REIT metrics have changed over time, and we have not been able to locate same-store NOI data further back than 1998.
UMH Properties started reporting same-store NOI in 2015.
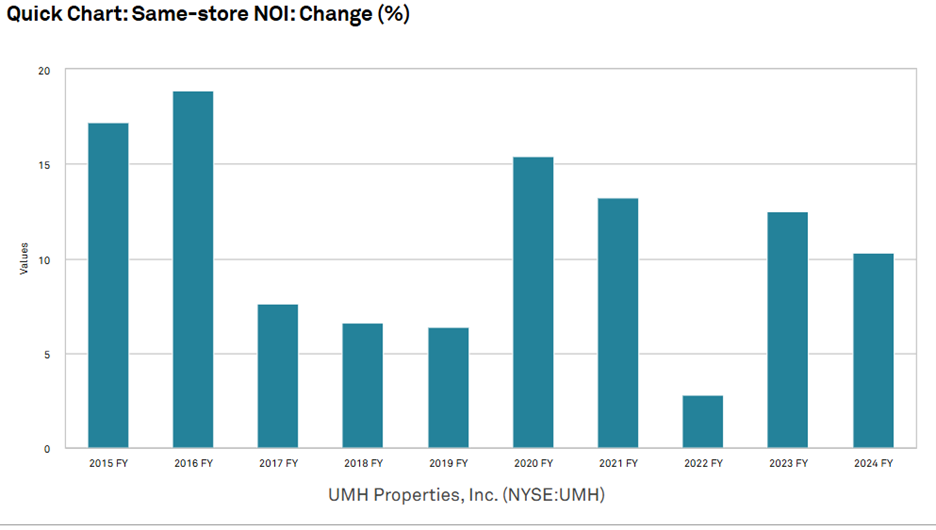
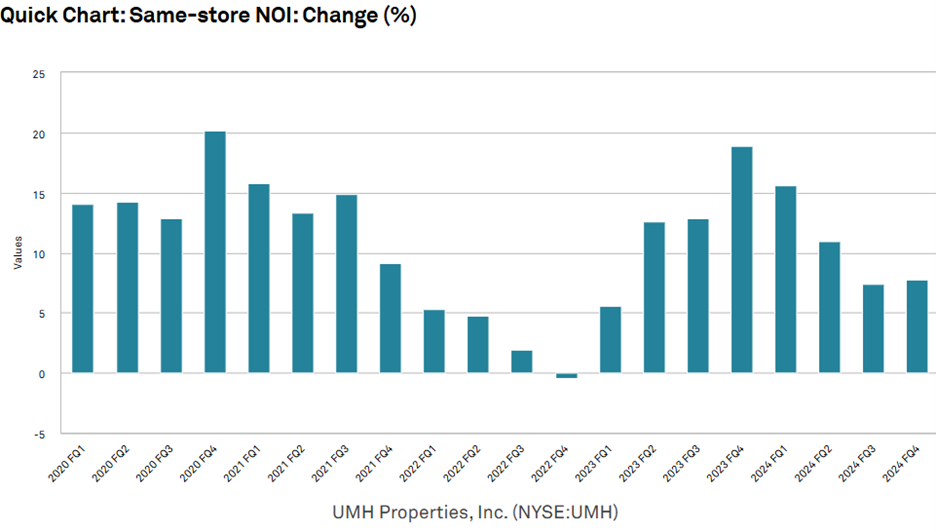
UMH’s same-store NOI is substantially higher than that of peers, averaging just over 10% annually for the past decade.
We find the same-store NOI streak of the sector quite notable because it remained positive through the 2000 tech bubble bust recession, the Great Financial Crisis, and COVID.
27 years of straight boom years is not supposed to be possible in real estate. There are usually negative feedback mechanisms that prevent it.
Negative feedback mechanisms
When a sector gets too hot, developers will build a large amount of new supply, which in turn spreads the demand across more buildings and slows growth of existing assets.
This feedback mechanism is present in most real estate sectors. When apartments got too hot in 2021, developers built an extraordinary amount, and rent growth cooled in 2023-2024. The same thing happened in labs and to a lesser extent in industrial.
So why is this not stopping the 27 straight boom years of MH?
Well, supply is capped by burdensome regulations and red tape. So, while developing is sufficiently lucrative to entice development, the actual number of new units delivered is muted because of the difficulty of obtaining the right permits and zoning.
Real estate also has negative feedback mechanisms in the other direction. When a sector gets too cold, construction approaches zero, which then raises the profitability of existing properties, restoring the growth cycle.
This mechanism is entirely free-market and is not inhibited by regulation. As such, the favorable feedback mechanism remains in place for MH while the unfavorable feedback mechanism is not present.
This seems to make manufactured housing a superior sector. It is capable of growing for 27+ years straight while also having protections in place should there ever be a downturn. The fundamentals of MH have been truly stellar, and the market knows it. MH REITs trade at high multiples.
Sector valuation
UMH’s peers ELS and SUI trade at 23.2X and 20.1X 2026 estimated AFFO, respectively.

Due to the persistently strong same-store NOI growth, we think these low to mid-20 multiples are correct. That is the market properly pricing in the organic growth.
So why is UMH trading at only 16.1X 2026 AFFO?
We believe there are 2 reasons for UMH’s cheap stock price:
- UMH sold down in the recent tariff-related market crash
- A substantial amount of UMH’s assets are not recognized due to their delayed earnings.
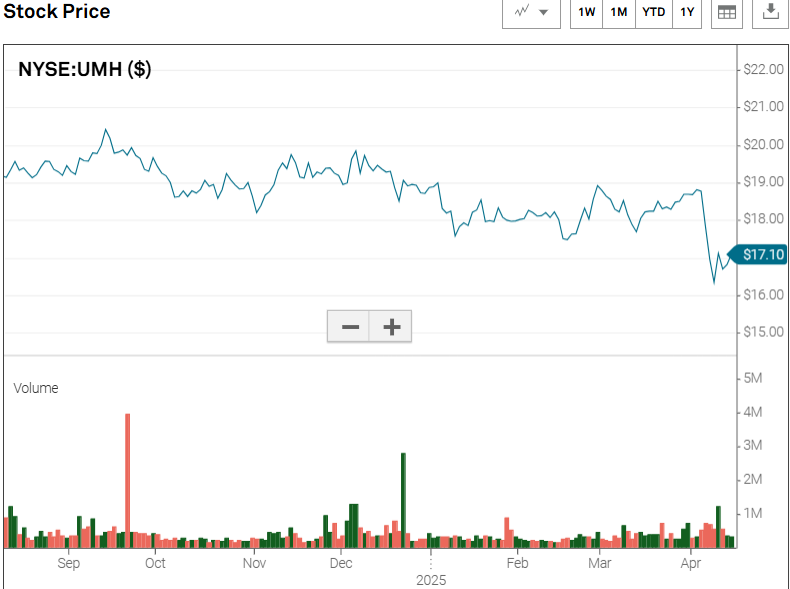
UMH is not fundamentally damaged by tariffs, and this portion of the selloff was simply getting caught with the market that sold down everything.
The other reason UMH trades cheaply could be that the market is confused by the relationship between UMH’s same-store NOI growth and its per share growth.
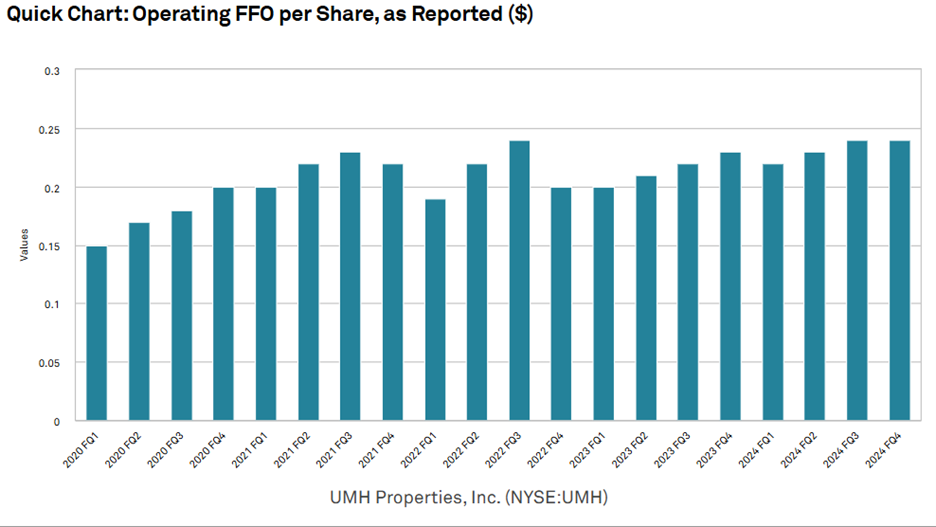
FFO/share growth has been decent, but one would expect 10% same-store NOI growth to translate into substantially more growth.
All else equal, 10% same-store NOI growth is closer to 20% AFFO/share growth as it is amplified by 3 factors:
- Leverage
- Operating margin improvement as rental rate growth does not come with incremental expense
- FFO margin improvement as overhead would become a smaller portion of revenues.
So, how does one square UMH’s consistent 10% same-store NOI with its much more modest per share growth?
The short answer is equity issuance.
Over the past 5 years, while UMH’s same-store NOI did this:
Share count doubled:
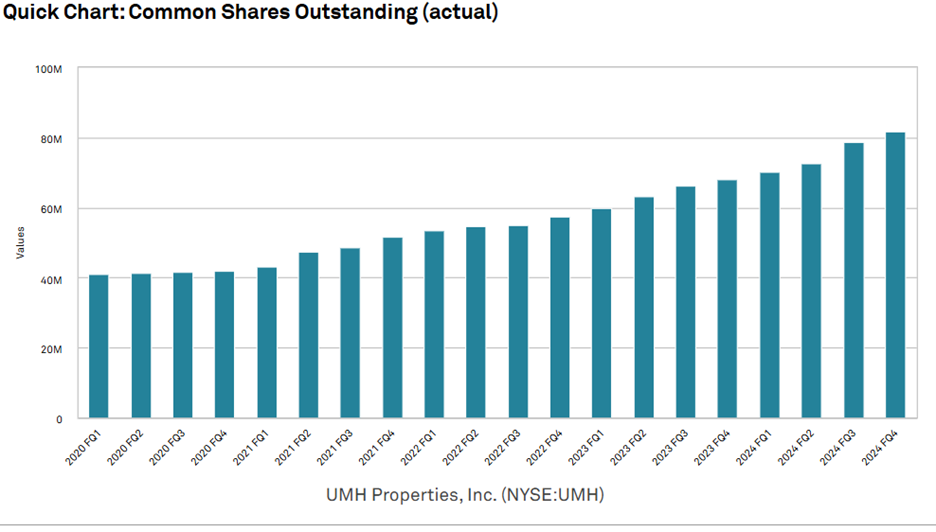
Thus, while NOI is much higher than it used to be, it is spread over twice as many shares, resulting in a muted impact to AFFO/share.
We think the market is well aware of rapid share issuance as the source of AFFO/share growth being only modest. There is a question on it in just about every conference call.
However, we think the market is much less aware of where all that capital is going.
In theory, equity issuance isn’t necessarily dilutive to AFFO/share. Much of UMH’s issuance has been at approximately 17X-19X AFFO, which would be a cost of capital between 5.2% and 5.9%. Per the annual report, UMH’s return on invested capital in building MH communities is closer to 10%.
“Our rental home investments typically yield an unlevered return of approximately 10% annually.”
If UMH issues equity and invests the proceeds in MH development, that is accretive to AFFO/share rather than dilutive. Thus, it can seem a bit murky as to how the equity issuance would have resulted in AFFO/share growth being sluggish relative to same-store NOI growth.
We believe there are 3 underlying reasons for the disparity in NOI and AFFO/share growth rates.
- Same-store NOI is not 100% organic
- Deleveraging
- Time delay of accretion on fresh investments
Same-store NOI growth consists primarily of rental rate growth and occupancy growth.
Increasing rental rates is essentially 100% margin. UMH can tick rental rates up at a rate of about 5% a year and has a long runway in which to do so because of the vast difference in cost between MH and apartments.
The rest comes from occupancy growth, which is not 100% margin. Increasing occupancy requires some investment, ranging from minor community level stuff like connecting water to buying a new rental home for the renter to occupy. Incremental occupancy is very accretive, and the investment required to facilitate the move in is extremely high ROIC, but it is not free.
Thus, the 10% same-store NOI growth is not entirely free. It requires some amount of capex.
Deleveraging
UMH has put a portion of its equity issuance toward deleveraging, with debt to gross properties dropping from over 60% to under 40%.
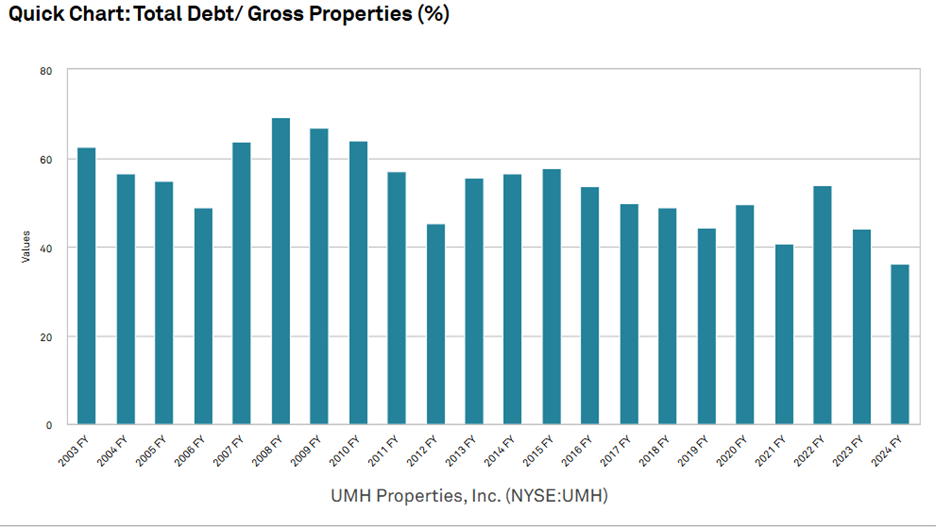
Much of the delevering has occurred in the last 3 years.
It isn’t necessarily paying off debt, so much as new investments having a higher percentage of equity financing.
Deleveraging is almost always going to be dilutive for a REIT because the cost of debt capital is lower than the cost of equity capital.
This is particularly true for UMH because it has access to Fannie and Freddie loans at very low rates due to being a provider of housing. Per company filings regarding mortgage debt:
“The weighted average interest rate was 4.2% as of December 31, 2024.”
UMH is now quite low leverage. Getting there was dilutive to AFFO/share, but it has benefits in lowering risk and increasing liquidity going forward.
It is worth noting that remaining at low leverage is NOT a drain on AFFO/share growth. It was merely the process of getting to low leverage.
Time delay of accretion on fresh investments
UMH’s growth is quite a bit different than that of a triple net REIT. A triple net REIT will buy a fully occupied property with a lease already in place, so it starts cashflowing on day 1.
UMH’s growth is a bit more nuanced.
Over the past few years, UMH has bought a large number of communities, vacant lots, and land.
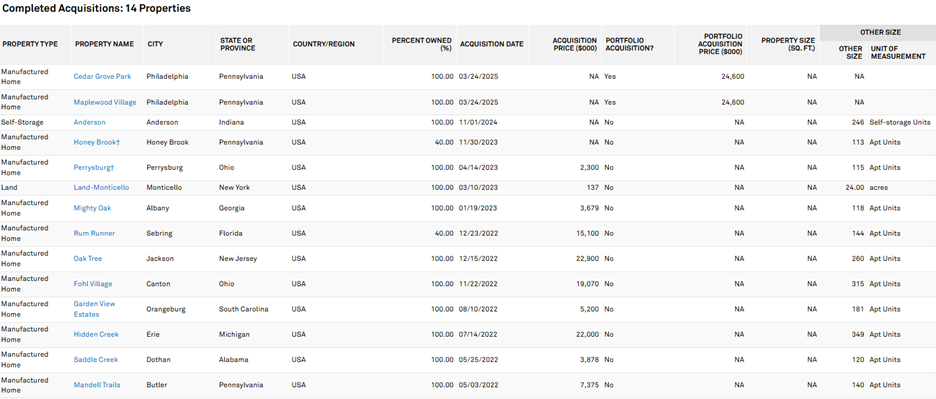
Most of these purchases are not at 100% of cashflow yet. Some are still at 0 and some are at negative NOI.
The low starting cashflows do not represent failure, but rather part of the process. If one were to buy a fully stabilized and well-run MH community, it would come at a low cap rate around 4.5%-6.5%, depending on location and growth trajectory.
UMH buys communities at low occupancy or those that are poorly managed. In so doing, they can acquire for as cheaply as $30,000 per site. After purchase, UMH adds amenities, kicks out troublemaking tenants, and applies other capex to make the community a more uplifting place to live.
As this process completes, occupancy will start to ramp up, and rental rates can be substantially higher as the community is nicer. Full cycle, UMH tends to achieve strong IRRs on these investments, but it takes as much as a few years to fully get going.
Given the cadence of UMH’s growth, they currently have a particularly large amount of assets like those above, which are either not yet cashflowing or only partially cashflowing.
Essentially all of UMH’s NOI comes from its 23,000 occupied homesites. 10,300 are rental homes, with the balance owned by tenants and the lots rented from UMH.
The non-cashflowing assets are:
- 3,300 vacant sites that are mostly developed and ready for occupancy.
- 9,600 land plots available to develop into homesites.
- ~500 home inventory not yet assigned to homesites
That is a substantial amount of future growth assets that are not yet a part of AFFO.
We think the market is making a mistake in valuing UMH just on its AFFO and not attributing value to the future growth the company has acquired. Permitting and zoning are among the most challenging aspects of developing MH so having all these vacant sites adjacent to existing communities allows UMH to expand while competitors might get gummed up in the red tape.
AFFO trajectory
We anticipate same-store NOI to remain in the same 8%-12% ballpark driven by roughly 5% rental rate growth along with occupancy uptake. However, it is now positioned to roll through to AFFO/share much more effectively. Specifically, there are 2 reasons AFFO/share flow through will be better:
- Capital stack is already low leverage so forward equity to debt ratio should be flatter.
- A large portion of existing assets are on the cusp of reaching the profitable cashflow stage.
With AFFO/share growth more in line with what one would expect given the strong same-store NOI growth, we think the market will attribute a multiple to UMH more in line with that of MH peers.
We see fair value as roughly 30% above current share price.
Risks to UMH
- Removal of red tape could potentially allow competing supply to come in and restore the missing negative feedback mechanism that allowed MH to grow so consistently. Politicians may attempt to do this as a means of combating the housing crisis.
- Supply chain difficulties have been intermittently present in manufactured housing, which can slow occupancy uptake even if demand is strong. Some believe that tariffs could either bottleneck supply chains or simply increase prices.
UMH is partially sheltered from supply chain disruption as they have approximately 500 homes in inventory, but if supply were a longer-term issue, they would eventually run out. At full sales and rental pace, this would last just under 2 quarters.
Wrapping it up
UMH has growth that far exceeds what is implied by its AFFO multiple. We think the multiple will expand as this growth is realized for overall significant gains to market price.
Notes and Disclosure
Articles are provided for informational purposes only. They are not recommendations to buy or sell any security and are strictly the opinion of the writer. The information contained in these articles is impersonal and not tailored to the investment needs of any particular person. It does not constitute a recommendation that any particular security or strategy is suitable for a specific person.
Investing in publicly held securities is speculative and involves risk, including the possible loss of principal. The reader must determine whether any investment is suitable and accepts responsibility for their investment decisions.
Commentary may contain forward-looking statements that are by definition uncertain. Actual results may differ materially from our forecasts or estimations, and 2MCAC and its affiliates cannot be held liable for the use of and reliance upon the opinions, estimates, forecasts, and findings in this article.
Past performance does not guarantee future results. Investing in publicly held securities is speculative and involves risk, including the possible loss of principal. Historical returns should not be used as the primary basis for investment decisions. Although the statements of fact and data in this report have been obtained from sources believed to be reliable, 2MCAC does not guarantee their accuracy and assumes no liability or responsibility for any omissions/errors.
We routinely own and trade the same securities purchased or sold for advisory clients of 2MCAC. This circumstance is communicated to clients on an ongoing basis. As fiduciaries, we prioritize our clients’ interests above those of our corporate and personal accounts to avoid conflict and adverse selection in trading these commonly held interests.
S&P disclosure: S&P Global Market Intelligence LLC. Contains copyrighted material distributed under license from S&P.
Hypertext links to other sites are provided strictly as a courtesy. When you link to any of the sites provided on our website, you are leaving this website. We make no representation as to the completeness or accuracy of information provided on these websites. Nor is the company liable for any direct or indirect technical or system issues or any consequences arising from your access to or your use of third-party technologies, websites, information, and programs made available through this website. When you access one of these websites, you are leaving our website and assume total responsibility and risk for your use of the websites to which you are linking.
Discover more from 2nd Market Capital Advisory Corp
Subscribe to get the latest posts sent to your email.