RTR Portfolio Review: Investing in clean business models at a discount
The market has a tendency to overly focus on revenue growth. We also like revenue growth in the companies in which we invest, but I think there is significant value in studying the entire industry verticals to find those where the revenue growth will filter through to real cashflows per share. Let me begin this portfolio review by showing examples of where revenue growth failed to result in success, and then follow with why we have selected the companies in the portfolio for their cleaner business models that better flow revenues to the bottom line.
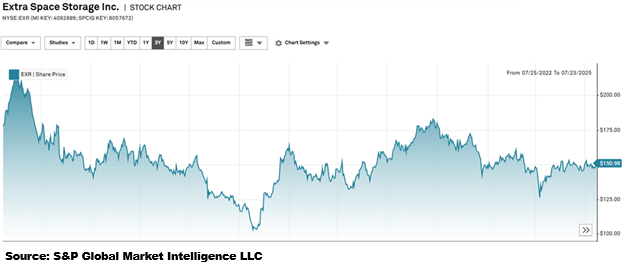
In the aftermath of the pandemic, as people were being displaced, demand for self-storage was explosive. Those who bought into self-storage in response to the revenue growth were sorely disappointed.
In this case, they forgot to factor in that supply growth was equally explosive, and the even tougher part is that while demand can subside, the self-storage properties built to service it were permanent structures, leading to a long-term oversupply.
We view supply to be a key factor, and we continue to be overweight the more supply-constrained sectors like manufactured housing, shopping centers, billboards, and farmland.
In this month’s portfolio review, however, I want to focus the discussion more on the cleanliness of business models.
Starting from the revenue side, demand growth is indeed a big factor. But beyond that, multiple steps along the way determine whether that demand flows through to investors. Business models can be muddied up at either the company level or the industry level, and in either case, it results in poor margins. Look at hotels as an example.
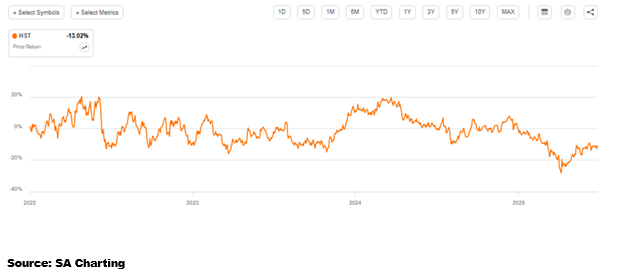
Hotel revenues (RevPAR) took off in the post-pandemic “revenge travel” and continued upward to hit all-time highs in 2025. Despite all-time high revenues, margins have been weak, and that is reflected in stock prices. HST is the largest hotel REIT and has had weak returns amidst the ample revenue growth.
The problem here is not at the company level, but rather the lack of cleanliness of the business model at an industry level.
The hotel business model suffers from low margins as brands (think Marriott) and online travel agencies (Expedia) capture a large portion of the profits despite the hotel owners (the REITs) taking almost all of the capital investment and capital risk.
The hotel business model also suffers from supply creep, as single-family homes and apartments can be converted to hotels overnight through Airbnb and peers.
That is just a rough business model, and I do not see prospects of it getting any cleaner. The problems are entrenched.
With that in mind, we will discuss the much cleaner business models of the companies in which we choose to invest.
We stick to our strategy rather than chasing whatever is hot. As such, we are almost guaranteed to miss out on meme stocks, crypto and everything else of the speculative variety. Instead, we focus on owning good companies with strong business models at discounted valuations. Over the long run, I think it works quite well.
A portfolio focused on clean business models
The majority of REITs operate multi-tenant properties in which some portion of leases are continuously rolling. As leases expire, contracts are renewed, or a new tenant is found. In bringing in a new tenant, the REIT will typically have to pay leasing commissions to the agent that sources the new tenant.
I would consider a REIT that follows this model to be of average cleanliness for a REIT. Many of the major REIT sectors follow this model, such as industrial, retail, healthcare, and office. However, the amount of expense incurred in leasing varies significantly by competitive dynamics.
Let us take a look at Office as an example of a sector that has very tenant-favored negotiations.
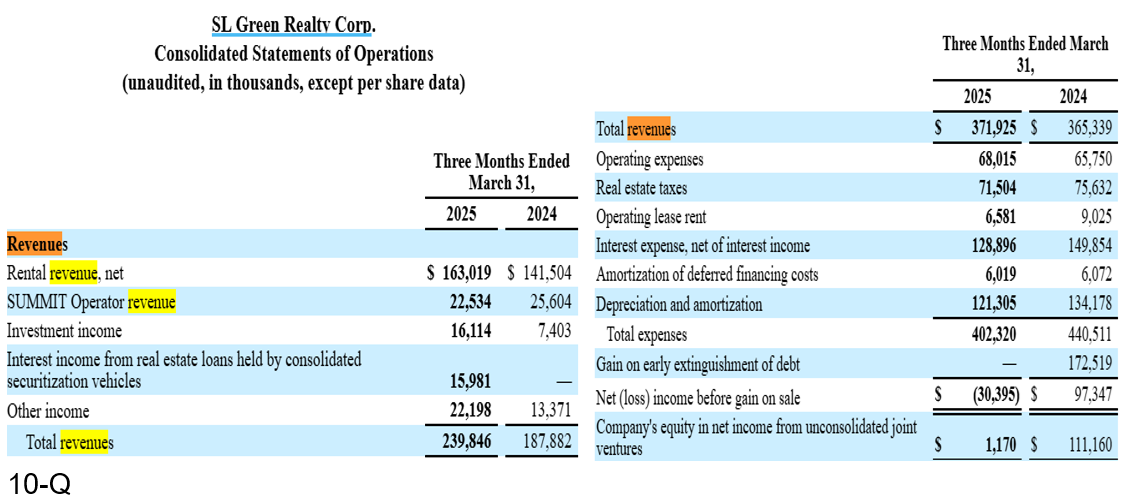
SL Green (SLG) is a well-managed company and has often been considered a blue chip within the office space. The expenses discussed below are not an SLG-specific problem, but rather endemic to the office sector. From the 10-Q, we can see total revenue of $240 million for the consolidated company and $372 million for joint ventures on the right side.
Compare these figures to the various leasing expenses discussed throughout the 10-Q:
“We estimate that for the remainder of the year ending December 31, 2025, we expect to incur $113.7 million of leasing capital expenditures and $20.9 million of recurring capital expenditures on existing consolidated properties.”
“Funds spent on capital expenditures, which are comprised of building and tenant improvements, increased from $55.3 million for the three months ended March 31, 2024, to $74.2 million for the three months ended March 31, 2025.”
Given the JVs and various accounting elections involved in how these expenses amortize, it would be quite a project to get to an exact figure for TI and Leasing Commissions (LC) as a percentage of revenue. As we do not invest in SLG, I’ll leave that effort to those who do, but just with the rough numbers above, it is clear that TI and LC are a very high percentage of revenue.
That makes Office presently one of the least clean business models. A massive portion of revenue is lost before it flows through to investors.
This problem is not inherent to the structure, but rather a consequence of the supply and demand environment. With rampant vacancy and low demand, tenants have all the power and are consistently negotiating tenant-favoring terms like free rent and high TI.
This negotiating power dynamic is present, favorably or unfavorably, in just about every REIT that follows the traditional leasing model, so it is one of the aspects to which we pay the closest attention.
Retail – business model becoming clean
Retail had a bad power dynamic for REITs from 2008-2018. It was an oversupplied asset class, and tenants could get favorable terms, with some of the most onerous being the following:
- Co-tenancy clauses
- Renewal options unilaterally at tenant’s option
- Low rent per foot relative to cost of property
Today, the dynamic is much more landlord favoring with new leases no longer having these bad terms. Landlords are now getting much higher rent per foot, and co-tenancy clauses are quite rare these days. Renewal options still exist in legacy leases, but are no longer built into forward leases. The existing renewal options are delaying the ability of REITs to mark rent to market, but they are starting to bleed off.
Going forward, shopping centers seem to have a fairly clean business model with expenses as a percentage of revenue trending down across the sector.
RTR is presently invested in multiple REITs within the shopping center space. There are a few more in the sector that we like as well, and we have been trading between the names frequently, depending on which looks most opportunistic at any given time.
I think the market is overlooking the seismic shift between legacy retail leases and those that are being signed today. Most of the shopping center REITs are raising rents 20%-50% as leases roll over. On top of the rent increases, the terms of the new leases are significantly cleaner for the REITs.
Industrial – medium cleanliness
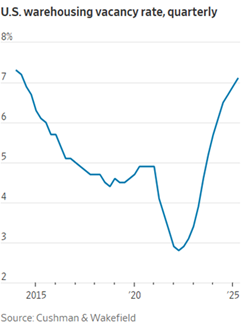
Industrial was white hot in the years following the pandemic as a large portion of companies bolstered their logistics networks. Today, it is more of a mixed bag as vacancy has ticked up materially to 7.1% in 2Q25.
Despite the vacancy, the rental rate side of leasing still looks quite good, with rental rates reaching a new all-time high according to a WSJ article citing Cushman and Wakefield research.
“The overall net rent increased to $10.12 per square foot in the second quarter, up about 3% from the same period a year earlier.”
Within Industrial, the cleanliness of the business model varies case by case, and we select accordingly.
Healthcare – normal business model with somewhat unfavorable leasing dynamics
Healthcare is a rather broad REIT sector with many different property type subsectors. Most of the subsectors operate on the traditional REIT leasing model, while senior housing is perhaps closer to apartments.
The model itself is of normal cleanliness, but is currently on the weaker side due to unfavorable industry dynamics. In the supply and demand sense, healthcare properties generally look okay. Neither hospitals nor MOBs are oversupplied. Instead, the challenges of the industry seem to be more related to the regulatory and insurance overlay, which moves in ways that are frankly difficult to predict. I was largely looking at the supply and demand fundamentals in getting into healthcare REITs, and admittedly underestimated the difficulties that would come about from the regulatory side.
Going forward, I think healthcare leasing will improve slowly but remain slightly weak. It is not a sector I would want to invest in at normal AFFO multiples, but the valuations are so extremely cheap that I think it is worth taking on the difficult operating environment.
Triple net, as a business model, is split on its cleanliness. Sale-leaseback transactions are excellent, while the 2nd round of leasing is a bit messier.
Many sale leasebacks are brokered directly between the REIT and the in-place tenant, at which point the REIT buys the property from the tenant and gets a long-term lease. Since the same tenant will generally occupy after the transaction, there is significantly reduced need for tenant improvement (TI) because the property is already configured for their needs.
Lease renewal is a bit messier. As the initial lease expires, the landlord will either renew with the same tenant or bring in a new one. Renewal is a bit cheaper but still involves TI, while finding a new tenant will typically incur a significant leasing commission.
So, this makes triple net as an asset class a bit mixed. The REITs can usually get significant growth upon acquiring through sale-leasebacks, but the organic growth on renewal is lower than would be expected for the asset class. For example, industrial REITs like PLYM, STAG, and PLD are getting very large rent increases on re-leasing (+20%-+80%) while triple net industrial is more of a slight roll-up and largely neutral after accounting for TI and LC.
Some industrial REIT leases may technically be triple net, but there is significant difference between a STAG, which is more industrial REIT style, and a BNL, which is more triple net REIT style. Regarding the specific triple net REITs in RTR, here is our analysis of the cleanliness of the business model.
Broadstone Net Lease – as discussed above, BNL, like most triple nets, takes a bite on the second round of leasing, which is why organic growth is in the 1%-3% range despite it having a mostly industrial portfolio that would typically have higher organic growth. An advantage BNL has over peers, however, is its extensive build-to-suit development pipeline. Build-to-suits are similarly clean to sale-leaseback transactions, allowing BNL to get above market cap rates on its investment. Overall, I think BNL is an excellent value at 10.6X FFO.
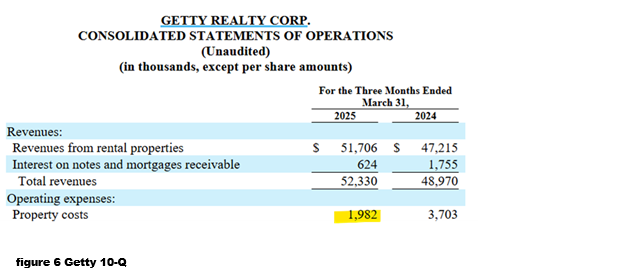
Getty Realty – has some advantages due to the niche in which it participates. It does a good number of sale leasebacks directly with tenants, allowing for clean entry into properties. The second round of leasing is also cleaner than normal due to the nature of convenience stores. So much of the value is in the corner locations while the real estate itself is extremely basic. As such, minimal capex is required. Note in the 10-Q that property costs are just 3.8% of revenues, which is very low compared to most REITs.
Property costs are defined as follows in GTY’s 10-Q:
“Property costs are comprised of (i) property operating expenses, including rent expense, reimbursable and non-reimbursable real estate taxes and municipal charges, certain state and local taxes, and maintenance expenses, and (ii) leasing and redevelopment expenses, including professional fees, demolition costs, and redevelopment project cost write-offs, if any.”
That is a fairly all-inclusive definition. Overall, opex at GTY is low, and I rate their business model as among the cleanest.
W.P. Carey – Working within the concept that sale leasebacks are efficient while 2nd round leasing is messier, WPC maximizes the portion of its revenues that come from first round leasing by signing extremely long leases in its initial sale leasebacks.
WPC works directly with tenants in their initial sale leasebacks and signs leases that are significantly longer than most peers. Most WPC leases are initially over 15 years, with many over 25 years. In so doing, WPC has somewhat low leasing expenses relative to the size of its property portfolio, making it moderately cleaner than the average triple net.
Direct leasing with tenants
While the traditional REIT model involves leasing agents as intermediaries, many REIT subsectors lease directly with tenants. In general, I think direct leasing is a cleaner model, and we are heavily overweight REITs in these off-the-beaten-path sectors.
Apartments are the most mainstream of those that directly lease to tenants, but it is still a remarkably clean business model. Leasing is generally handled by on-site personnel who also handle operations and maintenance. Recurring capex is largely just maintaining the condition of the property, which I consider cleaner than tenant improvement allotments because it makes the property more desirable to any tenant, not just the tenant associated with the individual lease.
Apartments also have an interesting dynamic in which they can charge more for loyal customers, meaning those who already live there. Renewal rates are often a few percentage points higher than rent for a new tenant in an identical unit. This dynamic is extremely annoying for renters, but a clear positive for the apartment business model.
Manufactured housing has a business model that is split between renting and selling.
The rental side is quite similar to apartments in that it leases living space directly to individual tenants, while the sales model is essentially renting the plot of land continuously after initial gains from the sale of the home.
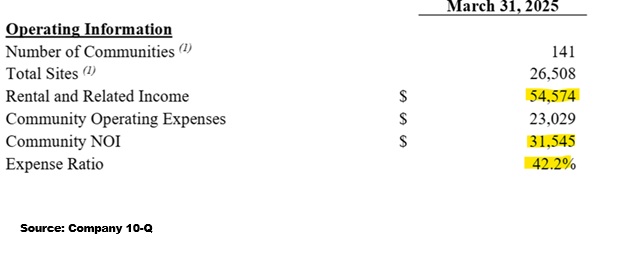
The manufactured housing stock owned by RTR has a 58% operating margin.
As communities mature and reach stabilized occupancy, we anticipate operating margin rising even further.
Farmland tends to lease directly to the farmers with minimal TI and LC. I consider it a very clean business model with respect to traditional row crops, which is one of the reasons we prefer Farmland Partners (FPI) within the sector.
FPI is majority row crops with just a small amount of specialty crops, while Gladstone Land is mostly specialty crops.
I find specialty crops like orchards or other permanent crops to be a significantly less clean business model for a REIT because the permanent crops themselves are a hidden form of tenant improvement cost.
Consider a fully planted orchard with mature, fruit-bearing trees. A tenant will lease the property and get to harvest those trees, which garners a premium rent per acre as compared to row crops. However, the trees have a finite life and will eventually need to be regrown, which incurs both expenses and downtime.
The expense of growing the trees is capitalized and depreciated over time, which shows up in the depreciation column and is added back to FFO and AFFO. However, I see it as more of a leasing expense, which, in my opinion, detracts from the true cashflows of the REIT.
Billboards – clean with help from oligopoly
Billboards have extremely short lease terms, so they are constantly finding new tenants or renewing leases. Lamar expenses the cost of doing so immediately, and it flows through this line item.
Overall, Lamar has strong operating margins that grow over time.
Billboards in general seem to be at an advantage in lease negotiations because of the oligopoly of the sector. There are only a few players that own the majority of the billboards, such that each has a massive market share.
Putting it together
There are roughly 170 equity REITs across 23 property subsectors. Our job in actively managing investment assets is to comb through each sector and each individual company to find those with a favorable mix of attributes. It is not infallible, but we think significant advantage can be gleaned through investing in companies with clean business models that happen to be trading at attractive valuations.
Evolving economies create opportunity
Our REIT Total Return Portfolio is actively managed to pivot into wherever the opportunity is greatest. We are now offering portfolio mirroring in which the trades in our REIT Total Return Portfolio are automatically executed in client portfolios simultaneously and at the same price.
Important Notes and Disclosure
Material Market and Economic Conditions. March 2022-2023: Significant increases in the Federal Funds Rate by the Federal Reserve have caused REIT market prices to decline more than the broader markets. REITs rely on debt financing to acquire properties and fund their operations; expiring lower-cost debt is being refinanced at higher interest rates due to prevailing market conditions. March 2020: REIT Total Return’s value declined substantially as COVID shut down the economy. It recovered in 2021 as the economy reopened. January 2019: Tax-loss selling’s calendar expired and the government reopened on January 25, 2019. The combined effect caused our shares to rise more than the broader markets. December 2018: Another Fed-Funds rate hike, unresolved US-Chinese trade, a partial government shutdown, and an exaggerated tax-loss selling season put extreme downward pressure on equity prices. All of these factors contributed to diminished liquidity and more significant share price declines in small-cap/value issues; REIT Total Return is focused on small-cap/value issues, so our decline was significantly more precipitous.
Material Conditions, Objectives, and Investment Strategies. REIT Total Return is an actively managed investment portfolio of real estate equities, primarily common and preferred shares of REITs, with an aim to generate high total returns from a mix of dividends and capital appreciation.
All REIT Total Return Portfolio performance information on this page is based on the performance of the Portfolio Manager’s account, using the manager’s own funds. Performance of the Portfolio Manager's account is calculated by Interactive Broker on a daily time-weighted basis, including cash, dividends and earnings distributions, and reflects the deduction of broker commissions (when commissions were charged). Actual client returns will differ. **2nd Market Capital’s advisory fees are simulated and applied retroactively to present the portfolio return “net-of-fees”.
None of the performance information displayed on this page is based on the actual performance of any 2MCAC client account investing in this portfolio. The performance in a 2MCAC client account investing in this portfolio may differ (i.e., be lower or higher) from the performance of the account managing this portfolio and portrayed on this page based on a variety of factors, such as trading restrictions imposed by the client (resulting in different account holdings), time of initial investment, amount of investment, frequency and size of cash flows in and out of the client account, applicable brokerage commissions (when commissions were charged), and different corporate actions. Clients investing in this portfolio may view the actual performance of their investment in this portfolio by logging into their Interactive Brokers account and reviewing their customized dashboard.
Clients may restrict any of the securities traded in their account but should note that any restrictions they place on their investments could affect the performance of their account leading it to perform differently, worse or better, than (a) the above-portrayed account or (b) other client accounts invested in the same portfolio.
Forward-looking statements. Commentary may contain forward-looking statements which are by definition uncertain. Actual results may differ materially from our forecasts or estimations, and 2MCAC cannot be held liable for the use of and reliance upon the opinions, estimates, forecasts, and findings in these documents.
Past performance does not guarantee future results. Investing in publicly held securities is speculative and involves risk, including the possible loss of principal. Historical returns should not be used as the primary basis for investment decisions. Although the statements of fact and data in this commentary have been obtained from sources believed to be reliable, 2MCAC does not guarantee their accuracy and assumes no liability or responsibility for any omissions/errors.
Use of Leverage or Margin. REIT Total Return Portfolio will utilize margin only for trading purposes (the ability to use the proceeds from stock sales immediately for new purchases instead of waiting for settlement), but not for borrowing purposes.
Benchmark Comparison. Our REIT Total Return Portfolio is compared to the Dow Jones Equity REIT Index and the MSCI U.S. REIT index because they are common REIT Indices. The Dow Jones Equity All REIT Index is designed to measure all publicly traded equity real estate investment trusts (REITs) in the Dow Jones U.S. stock universe. The MSCI US REIT Index is comprised of equity real estate investment trusts (REITs) eligible included within the eight Equity REIT Sub-Industries of the Equity Real Estate Investment Trust (REITs) Industry. It is not possible to invest directly in the Dow Jones Equity All REIT Index or MSCI US REIT index. Index returns do not represent the results of actual trading of investible assets/securities. Index returns do not reflect payment of any sales charges or fees an investor may pay to purchase the securities underlying the index. The imposition of these fees and charges would cause the actual performance of the securities to be lower than the Index performance shown. The results portrayed include dividend income. Our REIT Total Return Portfolio may include REITs that are not eligible for inclusion in the Dow Jones Equity All REIT Index or MSCI US REIT Index.
There can be no assurance that a benchmark will remain appropriate over time and 2MCAC will periodically review the benchmark’s appropriateness and decide to use other benchmarks if appropriate.
Expenses. Returns reflect the deduction of any transaction expenses. REIT Total Return's advisory fees are simulated and applied retroactively to present the portfolio return “net-of-fees”.
Calculation Methodology. Returns are calculated by 2MC with data from Interactive Brokers LLC using the Modified Dietz method, a time-weighted measure of performance in which cash flows are weighted based on their timing. Dividends in REIT Total Return are reinvested.
S&P Global Market Intelligence LLC. Contains copyrighted material distributed under license from S&P.
Discover more from 2nd Market Capital Advisory Corp
Subscribe to get the latest posts sent to your email.
