
REIT Total Return Portfolio Update: 10-year Anniversary
10 years ago, we set out to prove that active management can outperform passive investing. On 7/1/16, we commenced trading in the REIT Total Return (RTR) portfolio with a goal to maximize total return and beat the REIT index.
Academic institutions have drilled efficient market theory into finance graduates such that even professional money managers are beginning to believe that alpha is unobtainable.
We accept the challenge. We will stubbornly endeavor to outperform.
On the 10th anniversary of REIT Total Return, I am happy to announce that we succeeded in that goal.
RTR returned 99.42% in the 10 years ended 6/30/2026 while the MSCI US REIT Index (RMS) returned 80.35%.
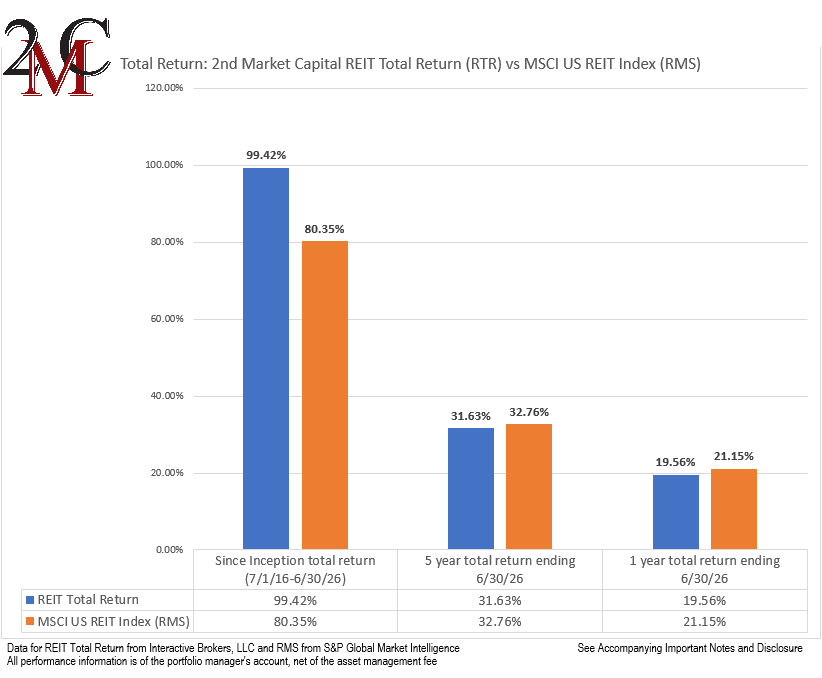
That is fully 19 percentage points of alpha over our benchmark.
In acknowledgement of the 10th anniversary of the portfolio, I want to discuss 4 things:
- Advantages of active versus passive investing.
- The philosophy under which RTR has and continues to operate.
- Today’s REIT environment and opportunities.
- RTR’s performance and process.
Active triumphing over passive
We firmly believe that active stock selection is superior to passive investing. While our 10-year performance serves as an example of active outperformance, I want to discuss 3 underlying mechanisms that present a continuous advantage to active:
- Passive fidelity to the index is imperfect
- Passive tends to follow trends too late
- Passive is often less diversified
While passive investing tacitly follows the indices, the fidelity is only as good as the ETFs that are meant to track them. A substantial portion of passive REIT investing occurs through the Vanguard Real Estate ETF (VNQ). It returned a mere 64.49% over the past 10 years while our actively managed REIT Total Return returned 99.42%.
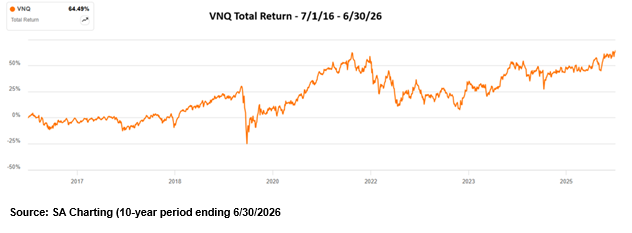
The VNQ exemplifies all 3 of the mechanical disadvantages of passive investing.
Tower REITs were a major success in the first 2 decades of the 21st century, but because they were initially a niche component consisting of only 1 and then 2 companies, tower REITs were not included in the VNQ.
It wasn’t until 2018 that the VNQ added tower REITs, and this was notably after the tower REIT outperformance. Beyond 2018, towers have been rather weak.
This will always be one of the greatest follies of passive investing.
Hot stock performance forces greater investment after the heat. When a stock or group of stocks outperforms, their relative weight increases, which forces them to become a higher percentage of index-tracking ETFs. Passive investing is intended to be diversified exposure to the whole market, but in practice it ends up becoming trend following.
This trend following breaks the diversifying aspect that it is supposed to have. While there are 21 distinct property types among REITs, market caps are quite unequal by sector, causing some to be massively overweighted and others to barely exist in the index. NAREIT’s research below highlights how sector weights have changed over time.
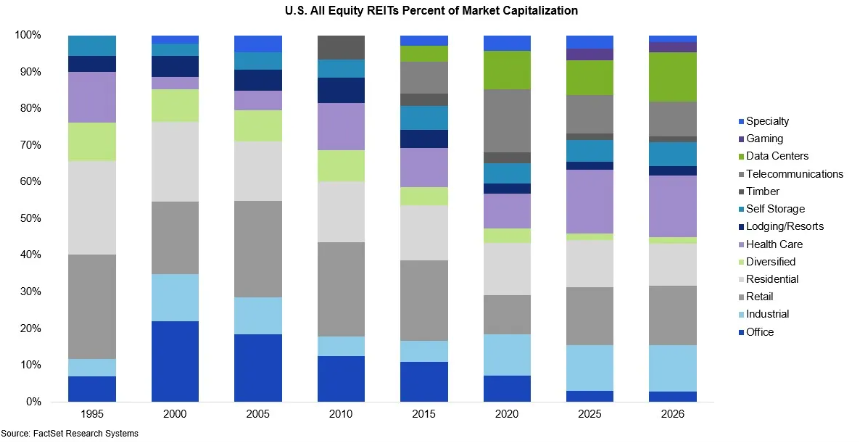
The biggest overweights often correspond to sector peaks, so index-based investing would continually be in the wrong place at the wrong time.
- Retail was the largest weight sector heading into the Great Financial Crisis.
- Office weight peaked at 20% in 2000, after which the internet, COVID, and work from home precipitously reduced demand for office space.
- Retail was at its smallest index weight in 2020, which incidentally would have been a fantastic time to buy the sector.
- Data center weight is at an all-time high presently, after the sector substantially outperformed.
In contrast, we as active investors can weigh sectors based on fundamentals and valuation. Below are RTR’s sector weights.
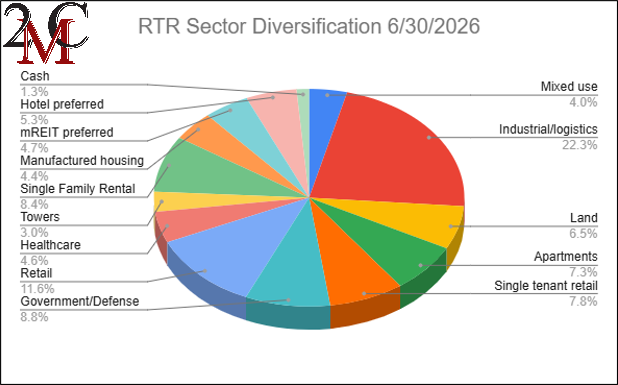
If a sector’s fundamental outlook is weak, we can have 0 exposure. If the outlook is strong and valuation is attractive, we can hold large overweights. Our buy decisions are not determined by market cap, but rather by ad hoc analysis of the present environment. Our philosophy is an enduring set of principles. It functions as a framework while preserving flexibility to adapt to a changing environment and current valuations.
Philosophy of 2nd Market Capital’s REIT Total Return
We believe that any given stock has a fair value based on its forward earnings and risk. This concept is shared by financial academia and efficient market theory, but we differ in one key point:
We believe market prices of stocks frequently and sometimes substantially deviate from fair value. Our job as active managers is to capture favorable deviations where price is below fair value and avoid stocks that are trading above fair value.
Our philosophy is rooted in fundamental analysis to get the best possible estimation of a company’s forward prospects. The composite of quality and growth should be directly correlated with trading multiple such that stocks should trade on the efficient price line below.
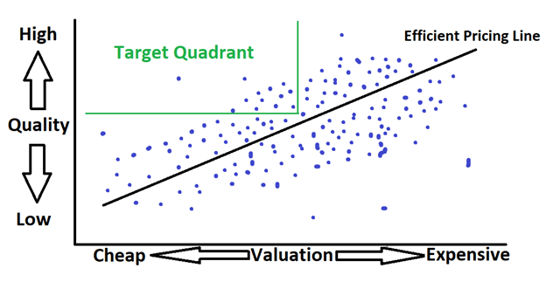
However, in practice, stock prices deviate substantially causing the REIT index to look more like the cloud of dots above.
These deviations cause a small subset of stocks to trade at multiples that are far too low for their quality, which allows us to buy stocks that are both value AND growth. Our belief is that consistently buying stocks that are trading significantly below fair value will result in higher returns over time as market prices will eventually trade toward fair value.
With that in mind, let us discuss some areas where pricing is presently deviated from fair value.
Opportunities in the current environment
REIT preferred shares are the Wild West of mispricing. Most REIT preferreds are quite small issues in the $50 million to $600 million range, which keeps them well under the radar of most institutional capital.
Daily trading volume is small, and there are large spreads between the bid and the ask. On any given day, the price can move as much as 6%, even without any fundamental news. Perhaps one of the current holders had to sell for personal reasons, and due to tiny volume, they have to sell into a void. The market price drops, but the fundamental value is the same as it was yesterday. Similar events frequently cause significant mispricing in REIT preferred shares.
Today, some of the most mispriced REIT preferreds are the hotel preferreds. In RTR we hold Pebblebrook Preferred H (PEB.PR.H).
Hotel REIT common shares have surged as much as 90% to the upside, yet the preferreds have not budged. The fundamental stability that comes with the larger and stronger underlying company directly benefits the reliability of the preferreds, so these instruments should trade at higher prices than when hotel REITs were on shakier ground a few years ago. However, likely due to the inefficiencies of REIT preferred pricing discussed earlier, the prices remain low, and the yields remain very high. This essentially allows us to buy PEB-H at the yield of a high-risk preferred even though its fundamental risk is medium to low.
Single-family homes are among the most liquid and highly visible forms of real estate. Much to the chagrin of would-be homebuyers, home prices have soared.
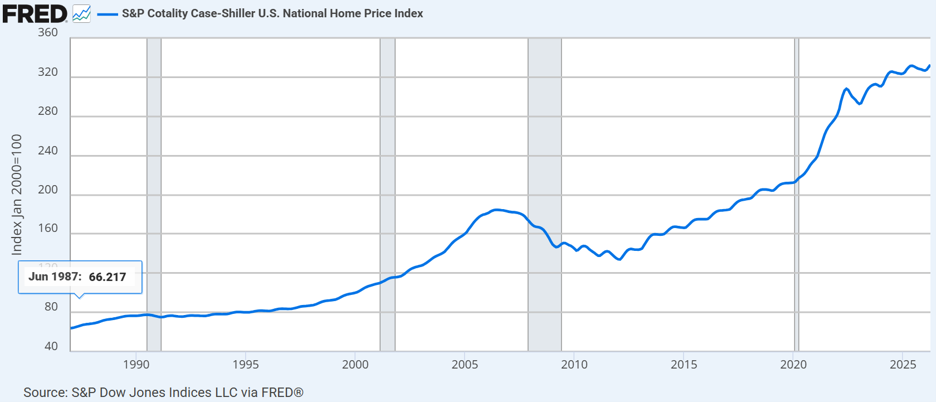
Countless single-family homes are bought and sold on a daily basis, with the sale prices publicly available. The sales comps allow analysts to determine with a high degree of certainty what a given home is worth.
Invitation Homes (INVH) is a single-family rental REIT that owns more than 86,000 homes. These homes have average values of about $400,000, yet INVH trades far below $400,000 per home. It is a strange juxtaposition of highly visible and tangible value and a market price that does not reflect it.
I happen to believe that a home that could sell on Zillow for $400,000 is probably worth about $400,000, so I will gladly buy it, or rather a portfolio of such homes, at prices closer to $300K where INVH has been trading.
RTR currently has 20 holdings. These are just examples of the kinds of things we buy where there is a clear deviation between fair value and market price.
REITs are healthier than 10 years ago
Over long stretches of time, REITs have proven to be one of the best asset classes, delivering high total return. The last decade was the exception, with low interest rates taking a bite out of REIT returns.
10 years ago, the Fed Funds rate hovered between 1% and 0%. It briefly climbed and then went all the way to 0 following COVID.
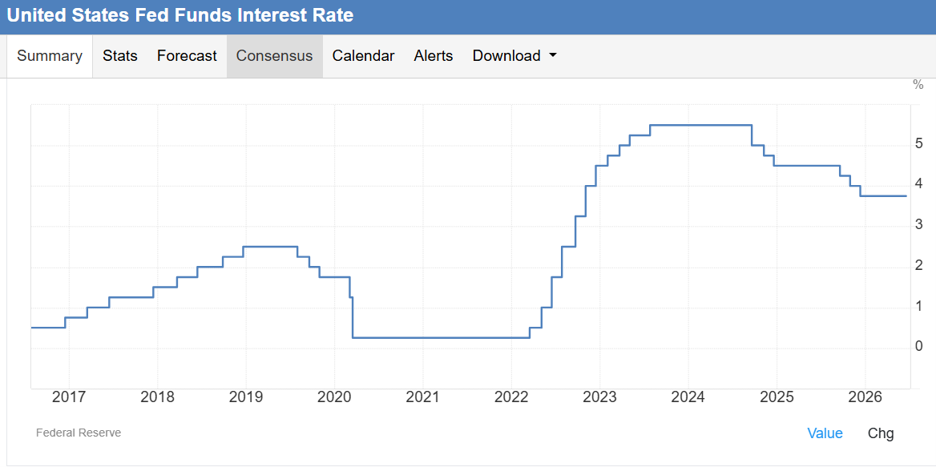
That was an incredibly unhealthy environment for real estate.
REITs are capital-intensive businesses. Their moat is the capital intensity.
Individuals and businesses rent because building their own buildings is too expensive.
When capital was free due to the zero-interest rate environment, that moat was severely weakened. Developers could build with impunity, and oversupply became an issue across many REIT sectors.
That led to weak rent growth as too many buildings competed for occupancy. It led to a decade of lackluster returns. REITs only went up 21.42% in 10 years, with the rest of the index return just coming from dividends.
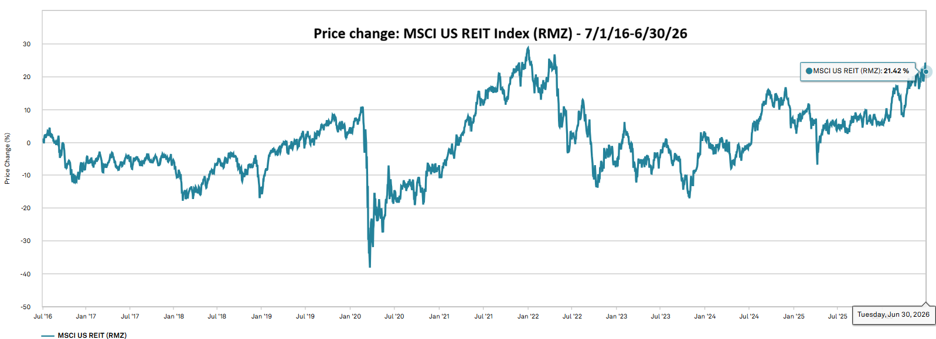
In 2022 and 2023, the moat was restored. Interest rates are back up to a healthy level and seem to be staying here. A 10-year Treasury yield between 3.5% and 5% is excellent for REITs.
Everything works with a lag because it can take a few years to develop depending on property type. So even though the moat was restored in 2022, oversupply persisted through 2025.
In 2026, there is strong evidence of equilibrium restoration. Optimism is coursing through REIT earnings calls as the pipeline of competing supply has slowed to a trickle. Occupancy is rebounding and landlords are once again getting pricing power.
- Retail and industrial REITs are already raising rents 10%-50% as leases roll over.
- Manufactured housing REITs have same-store NOI growth in the 5%-10% range.
- Triple net lease REITs are getting higher escalators at closer to 3%.
A few sectors are going to be a bit slower to recover
- Apartment rental rate growth is likely a 2027 event.
- Office could have more pain before an eventual rebound.
- Labs are still fending off oversupply.
Other sectors are white hot:
- Senior housing is in rapid recovery with year-over-year growth around 20%.
- Data centers have more demand than current pipelines are capable of building.
Choosing between sectors will be a careful matter of weighing forward fundamental prospects against valuation.
Overall, the REIT landscape is in a healthy place. It is springtime for property owners and the forward decade looks far stronger than the previous.
RTR process
REIT Total Return is actively managed. If a different stock becomes more opportunistic, it will replace a current holding. If a position approaches fair value either from appreciating in stock price or by the fundamental value dropping, it will be sold.
It has been a pleasure managing RTR for the past 10 years. Over the next decade, we intend to prove yet again that active management can outperform the index.
Evolving economies create opportunity
Our REIT Total Return Portfolio is actively managed to pivot into wherever the opportunity is greatest. We are now offering portfolio mirroring in which the trades in our REIT Total Return Portfolio are automatically executed in client portfolios simultaneously and at the same price.
Important Notes and Disclosure
Material Market and Economic Conditions. 2026: REITs traded mixed as strong fundamentals were offset by rapidly rising rates. Early 2025: REITs stayed relatively stable in the presence of tariff discussions that spooked the broader market. REITs were viewed as relatively isolated from world trade. March 2022-2023: Significant increases in the Federal Funds Rate by the Federal Reserve have caused REIT market prices to decline more than the broader markets. REITs rely on debt financing to acquire properties and fund their operations; expiring lower-cost debt is being refinanced at higher interest rates due to prevailing market conditions. March 2020: REIT Total Return’s value declined substantially as COVID shut down the economy. It recovered in 2021 as the economy reopened. January 2019: Tax-loss selling’s calendar expired and the government reopened on January 25, 2019. The combined effect caused our shares to rise more than the broader markets. December 2018: Another Fed Funds rate hike, unresolved US-Chinese trade, a partial government shutdown, and an exaggerated tax-loss selling season put extreme downward pressure on equity prices. All of these factors contributed to diminished liquidity and more significant share price declines in small-cap/value issues; REIT Total Return is focused on small-cap/value issues, so our decline was significantly more precipitous.
Material Conditions, Objectives, and Investment Strategies. REIT Total Return is an actively managed investment portfolio of real estate equities, primarily common and preferred shares of REITs, with an aim to generate high total returns from a mix of dividends and capital appreciation.
All REIT Total Return Portfolio performance information on this page is based on the performance of the Portfolio Manager’s account, using the manager’s own funds. Performance of the Portfolio Manager's account is calculated by Interactive Broker on a daily time-weighted basis, including cash, dividends and earnings distributions, and reflects the deduction of broker commissions (when commissions were charged). Actual client returns will differ. **2nd Market Capital’s advisory fees are simulated and applied retroactively to present the portfolio return “net-of-fees”.
None of the performance information displayed on this page is based on the actual performance of any 2MCAC client account investing in this portfolio. The performance in a 2MCAC client account investing in this portfolio may differ (i.e., be lower or higher) from the performance of the account managing this portfolio and portrayed on this page based on a variety of factors, such as trading restrictions imposed by the client (resulting in different account holdings), time of initial investment, amount of investment, frequency and size of cash flows in and out of the client account, applicable brokerage commissions (when commissions were charged), and different corporate actions. Clients investing in this portfolio may view the actual performance of their investment in this portfolio by logging into their Interactive Brokers account and reviewing their customized dashboard.
Clients may restrict any of the securities traded in their account but should note that any restrictions they place on their investments could affect the performance of their account leading it to perform differently, worse or better, than (a) the above-portrayed account or (b) other client accounts invested in the same portfolio.
Forward-looking statements. Commentary may contain forward-looking statements which are by definition uncertain. Actual results may differ materially from our forecasts or estimations, and 2MCAC cannot be held liable for the use of and reliance upon the opinions, estimates, forecasts, and findings in these documents.
Past performance does not guarantee future results. Investing in publicly held securities is speculative and involves risk, including the possible loss of principal. Historical returns should not be used as the primary basis for investment decisions. Although the statements of fact and data in this commentary have been obtained from sources believed to be reliable, 2MCAC does not guarantee their accuracy and assumes no liability or responsibility for any omissions/errors.
Use of Leverage or Margin. REIT Total Return Portfolio will utilize margin only for trading purposes (the ability to use the proceeds from stock sales immediately for new purchases instead of waiting for settlement), but not for borrowing purposes.
Benchmark Comparison. Our REIT Total Return Portfolio is compared to the Dow Jones Equity REIT Index and the MSCI U.S. REIT index because they are common REIT Indices. The Dow Jones Equity All REIT Index is designed to measure all publicly traded equity real estate investment trusts (REITs) in the Dow Jones U.S. stock universe. The MSCI US REIT Index is comprised of equity real estate investment trusts (REITs) eligible included within the eight Equity REIT Sub-Industries of the Equity Real Estate Investment Trust (REITs) Industry. It is not possible to invest directly in the Dow Jones Equity All REIT Index or MSCI US REIT index. Index returns do not represent the results of actual trading of investible assets/securities. Index returns do not reflect payment of any sales charges or fees an investor may pay to purchase the securities underlying the index. The imposition of these fees and charges would cause the actual performance of the securities to be lower than the Index performance shown. The results portrayed include dividend income. Our REIT Total Return Portfolio may include REITs that are not eligible for inclusion in the Dow Jones Equity All REIT Index or MSCI US REIT Index.
There can be no assurance that a benchmark will remain appropriate over time and 2MCAC will periodically review the benchmark’s appropriateness and decide to use other benchmarks if appropriate.
Expenses. Returns reflect the deduction of any transaction expenses. REIT Total Return's advisory fees are simulated and applied retroactively to present the portfolio return “net-of-fees”.
Calculation Methodology. Returns are calculated by 2MC with data from Interactive Brokers LLC using the Modified Dietz method, a time-weighted measure of performance in which cash flows are weighted based on their timing. Dividends in REIT Total Return are reinvested.
S&P Global Market Intelligence LLC. Contains copyrighted material distributed under license from S&P.
Discover more from 2nd Market Capital Advisory Corp
Subscribe to get the latest posts sent to your email.