
The State of REITs: August 2026 Edition
- REITs snapped a 3-month winning streak with a -0.49% average total return in July.
- Mid cap (+2.12%) and large cap REITs (+1.48%) continued to perform well, but small caps (-0.81%) and especially micro caps (-9.49%) struggled.
- 06% of REIT securities had a positive total return in July.
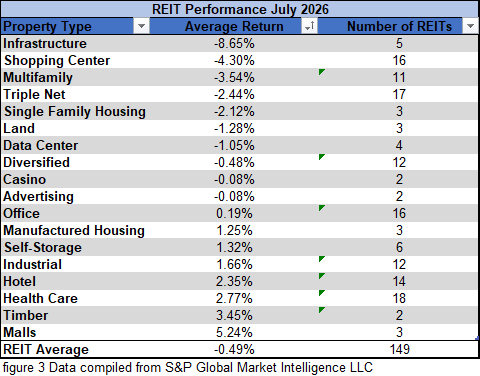
- 44% of REIT property types averaged positive returns, led by Malls (+5.24%) and Timber (+3.45%), while Infrastructure (-8.65%) and Shopping Centers (-4.30%) fell.
- The average REIT NAV discount narrowed slightly from -8.60% to -8.43% during July. The median NAV discount also narrowed from -10.56% to -9.44%.
REIT Performance
After strong gains during each month of the 2nd quarter, REITs dropped back slightly in July with an average return of -0.49%. REITs outperformed the NASDAQ (-3.2%) but fell short of the S&P 500 (-0.1%) and the Dow Jones Industrial Average (+0.4%). Year-to-date REITs are outperforming the broader market with an average return of +13.81% compared to smaller gains from the Dow (+10.2%), S&P 500 (+10.1%) and NASDAQ (+9.5%). The market cap weighted Vanguard Real Estate ETF (VNQ) outperformed the average REIT in July (+2.61% vs. -0.49%) and has narrowly exceeded the average REIT year-to-date (+14.02% vs. +13.81%). The spread between the 2026 FFO multiples of large cap (17.9x) and small cap REITs (13.2x) widened in July as multiples expanded 0.1 turns for large caps and contracted 0.9 turns for small caps. Investors currently need to pay an average of 45.5% more for each dollar of FFO from large cap REITs relative to small cap REITs. In this monthly publication, I will provide REIT data on numerous metrics to help readers identify which property types and individual securities currently offer the best opportunities to achieve their investment goals.
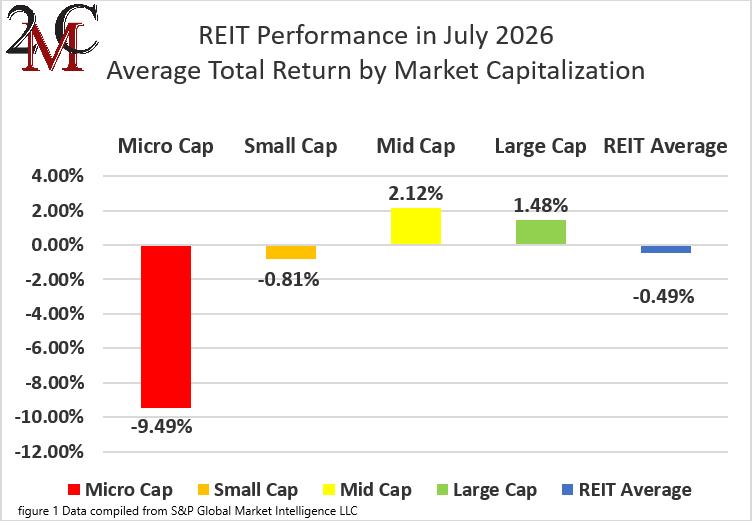
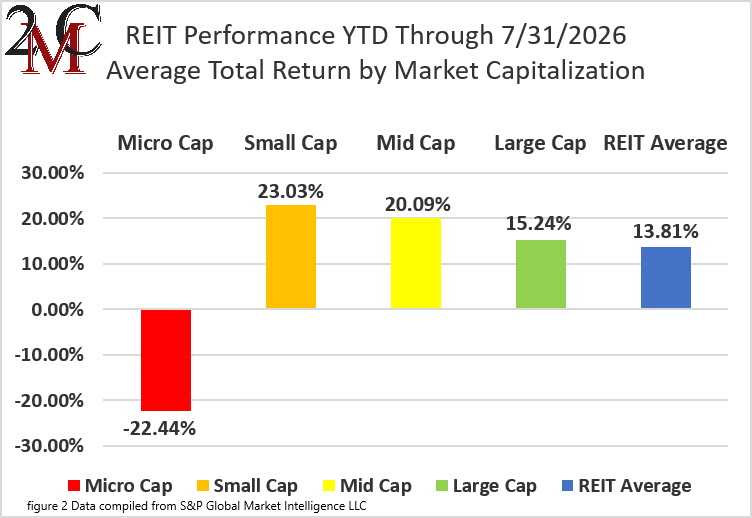
Mid cap (+2.12%) and large cap REITs (+1.48%) continued to perform well, but small caps finished the month in the red (-0.81%) and micro caps (-9.49%) yet again severely underperformed their larger peers. During the first seven months of 2026, small cap REITs have outperformed large caps by 779 basis points.
8 out of 18 Property Types Averaged Positive Returns in July
44.44% of REIT property types averaged a positive total return in July with a 13.89% total return spread between the best and worst performing property types. Malls (+5.24%) and Timber (+3.45%) led the REIT sector while Infrastructure (-8.65%) and Shopping Centers (-4.30%) badly underperformed in July.
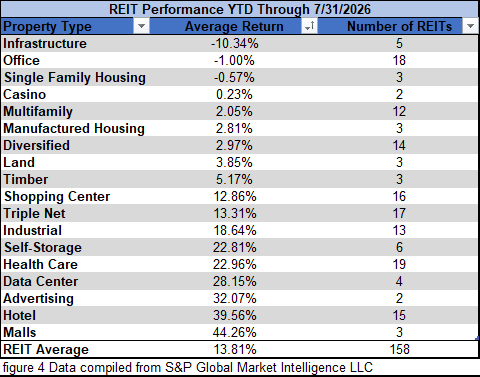
Over the first seven months of 2026, Infrastructure (-10.34%) and Office (-1.00%) were the only property types in the red. Malls (+44.26%), Hotels (+39.56%) and Advertising (+32.07%) have seen tremendous gains far exceeding the average REIT.
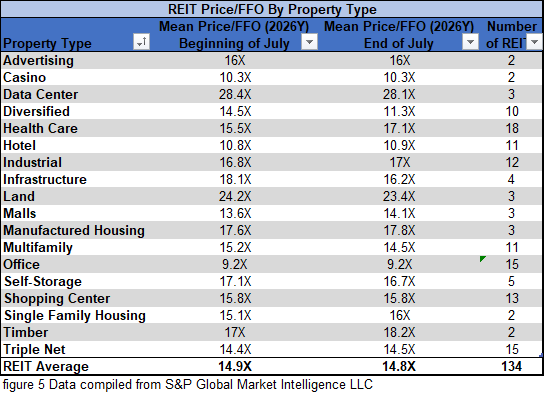
The REIT sector as a whole saw the average P/FFO (2026Y) decrease from 14.9x to 14.8x during July. 44.4% of property types averaged multiple expansion, 33.3% averaged multiple contraction and 22.2% saw the multiple hold steady. Data Centers (28.1x), Land (23.4x), Timber (18.2x) and Manufactured Housing (17.8x) currently trade at the highest average multiples among REIT property types. The property types with the lowest FFO multiples are Office (9.2x), Casinos (10.3x) and Hotels (10.9x).
Performance of Individual Securities
National Storage Affiliates Trust (NSA) was acquired by Public Storage (PSA) on July 22nd in a stock-for-stock transaction. NSA shareholders received 0.14 shares of PSA for each share of NSA held.
Whitestone REIT (WSR) was acquired and taken private by Ares Management Corporation (ARES) on July 14th. Whitestone had rejected multiple lower takeout offers before finally accepting this substantially better offer in which WSR shareholders received $19/share.
Rexford Industrial Realty (REXR) (+12.75%) was the best performing REIT in July due to a sharp rise after the release of their Q2 2026 earnings, which showed improved leasing volume as well as raised FFO/share guidance. Additionally, they announced plans to use asset sales to fund a massive $1B share buyback program and reduce leverage to only 3.5x.
Wheeler REIT (WHLR) (-90.54%) saw its freefall accelerate in July and WHLR has now reached a disgraceful -99.81% total return in just the first 7 months of 2026. An endless string of reverse stock splits (including three reverse splits between April 17th and July 28th) have failed to keep the share price from plummeting straight back down toward zero.
59.06% of REITs had a positive total return in July. REITs have averaged a stellar 13.81% year-to-date total return in 2026, a more than 2000 basis point outperformance of the disappointing -6.42% return for the REIT sector over the same period of 2025.
Dividend Yield
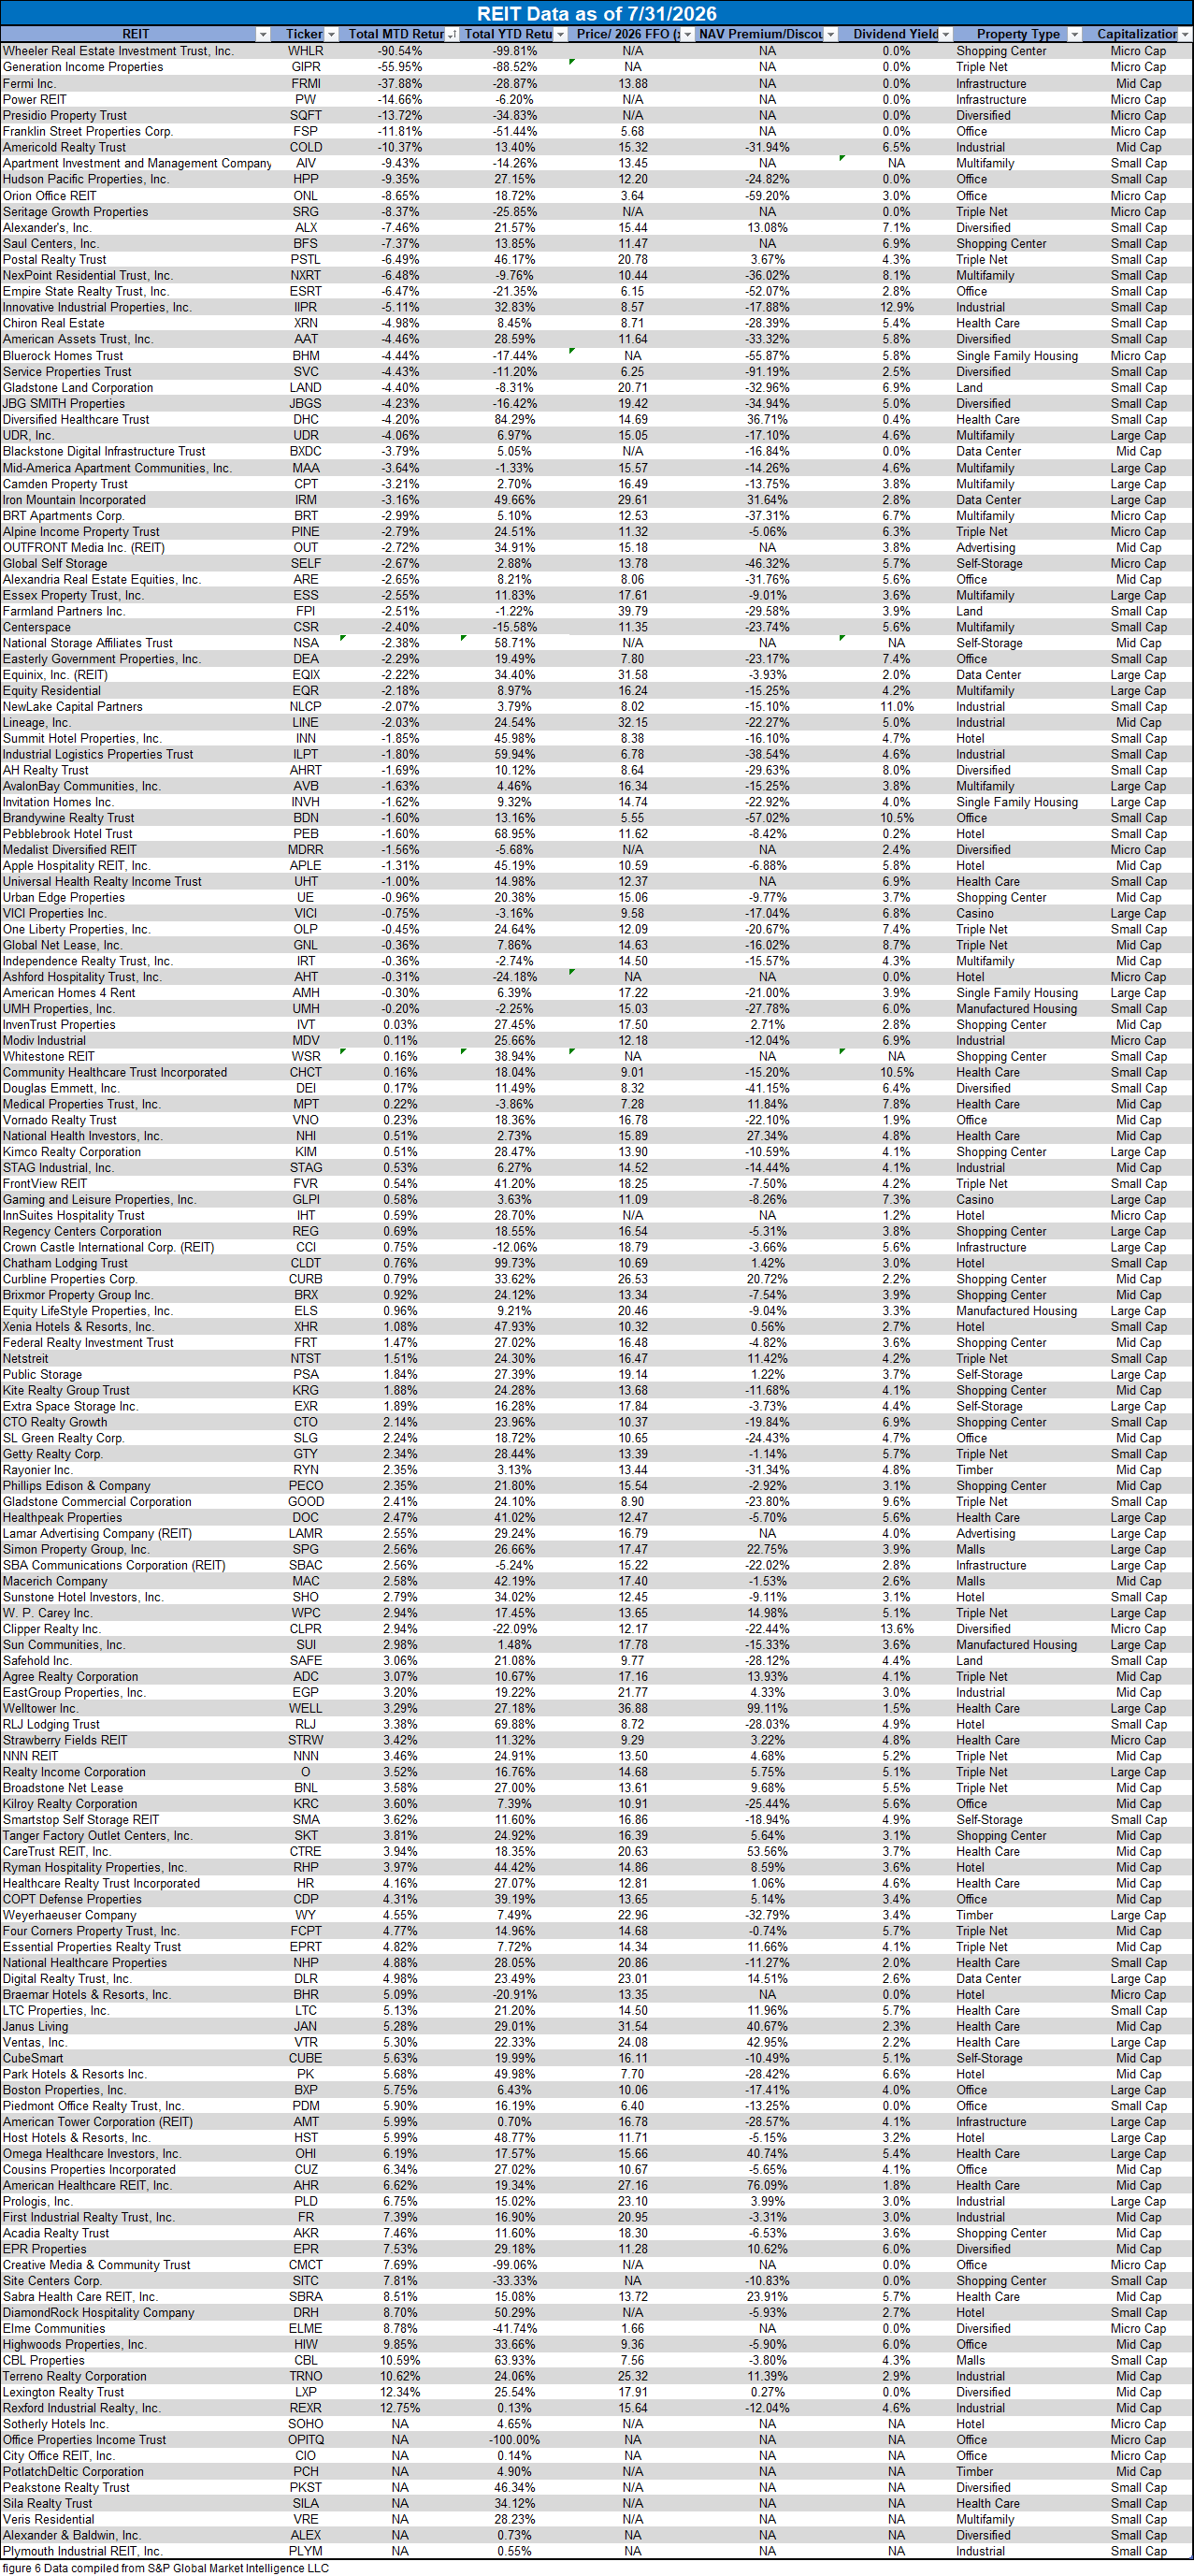
Dividend yield is an important component of a REIT’s total return. The particularly high dividend yields of the REIT sector are, for many investors, the primary reason for investment in this sector. As many REITs are currently trading at share prices well below their NAV, yields are currently quite high for many REITs within the sector. Although a particularly high yield for a REIT may reflect disproportionately high risk, opportunities exist in some cases to capitalize on dividend yields attractive enough to justify the investment’s underlying risks. I have included below a table ranking equity REITs from highest dividend yield (as of 7/31/2026) to lowest dividend yield.

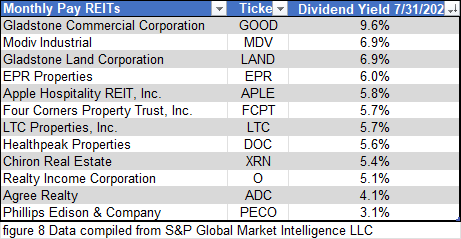
Although a REIT’s decision to pay a quarterly or monthly dividend does not reflect the quality of the company’s fundamentals or operations, a monthly dividend provides smoother cash flow for investors. Below is a list of equity REITs that pay monthly dividends, ranked from highest yield to lowest yield.
Dividend News
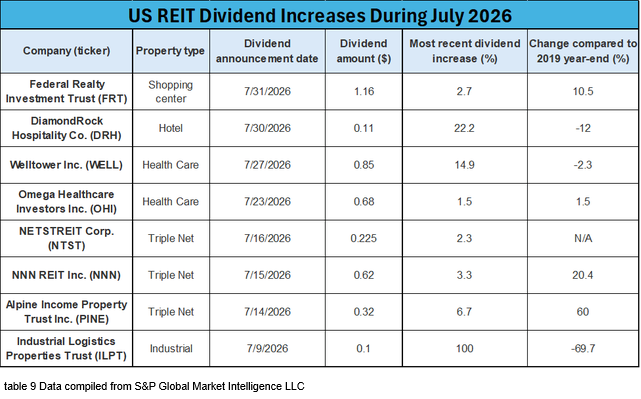
8 REITs announced dividend increases in July, all of which pay quarterly. Over the first seven months of 2026, 49 REITs have hiked their dividends. The biggest dividend hike in July was the doubling of the dividend by Industrial Logistics Properties Trust (ILPT) followed by +22.2% from DiamondRock Hospitality (DRH) and +14.9% from Welltower (WELL).
Valuation
REIT Premium/Discount to NAV by Property Type
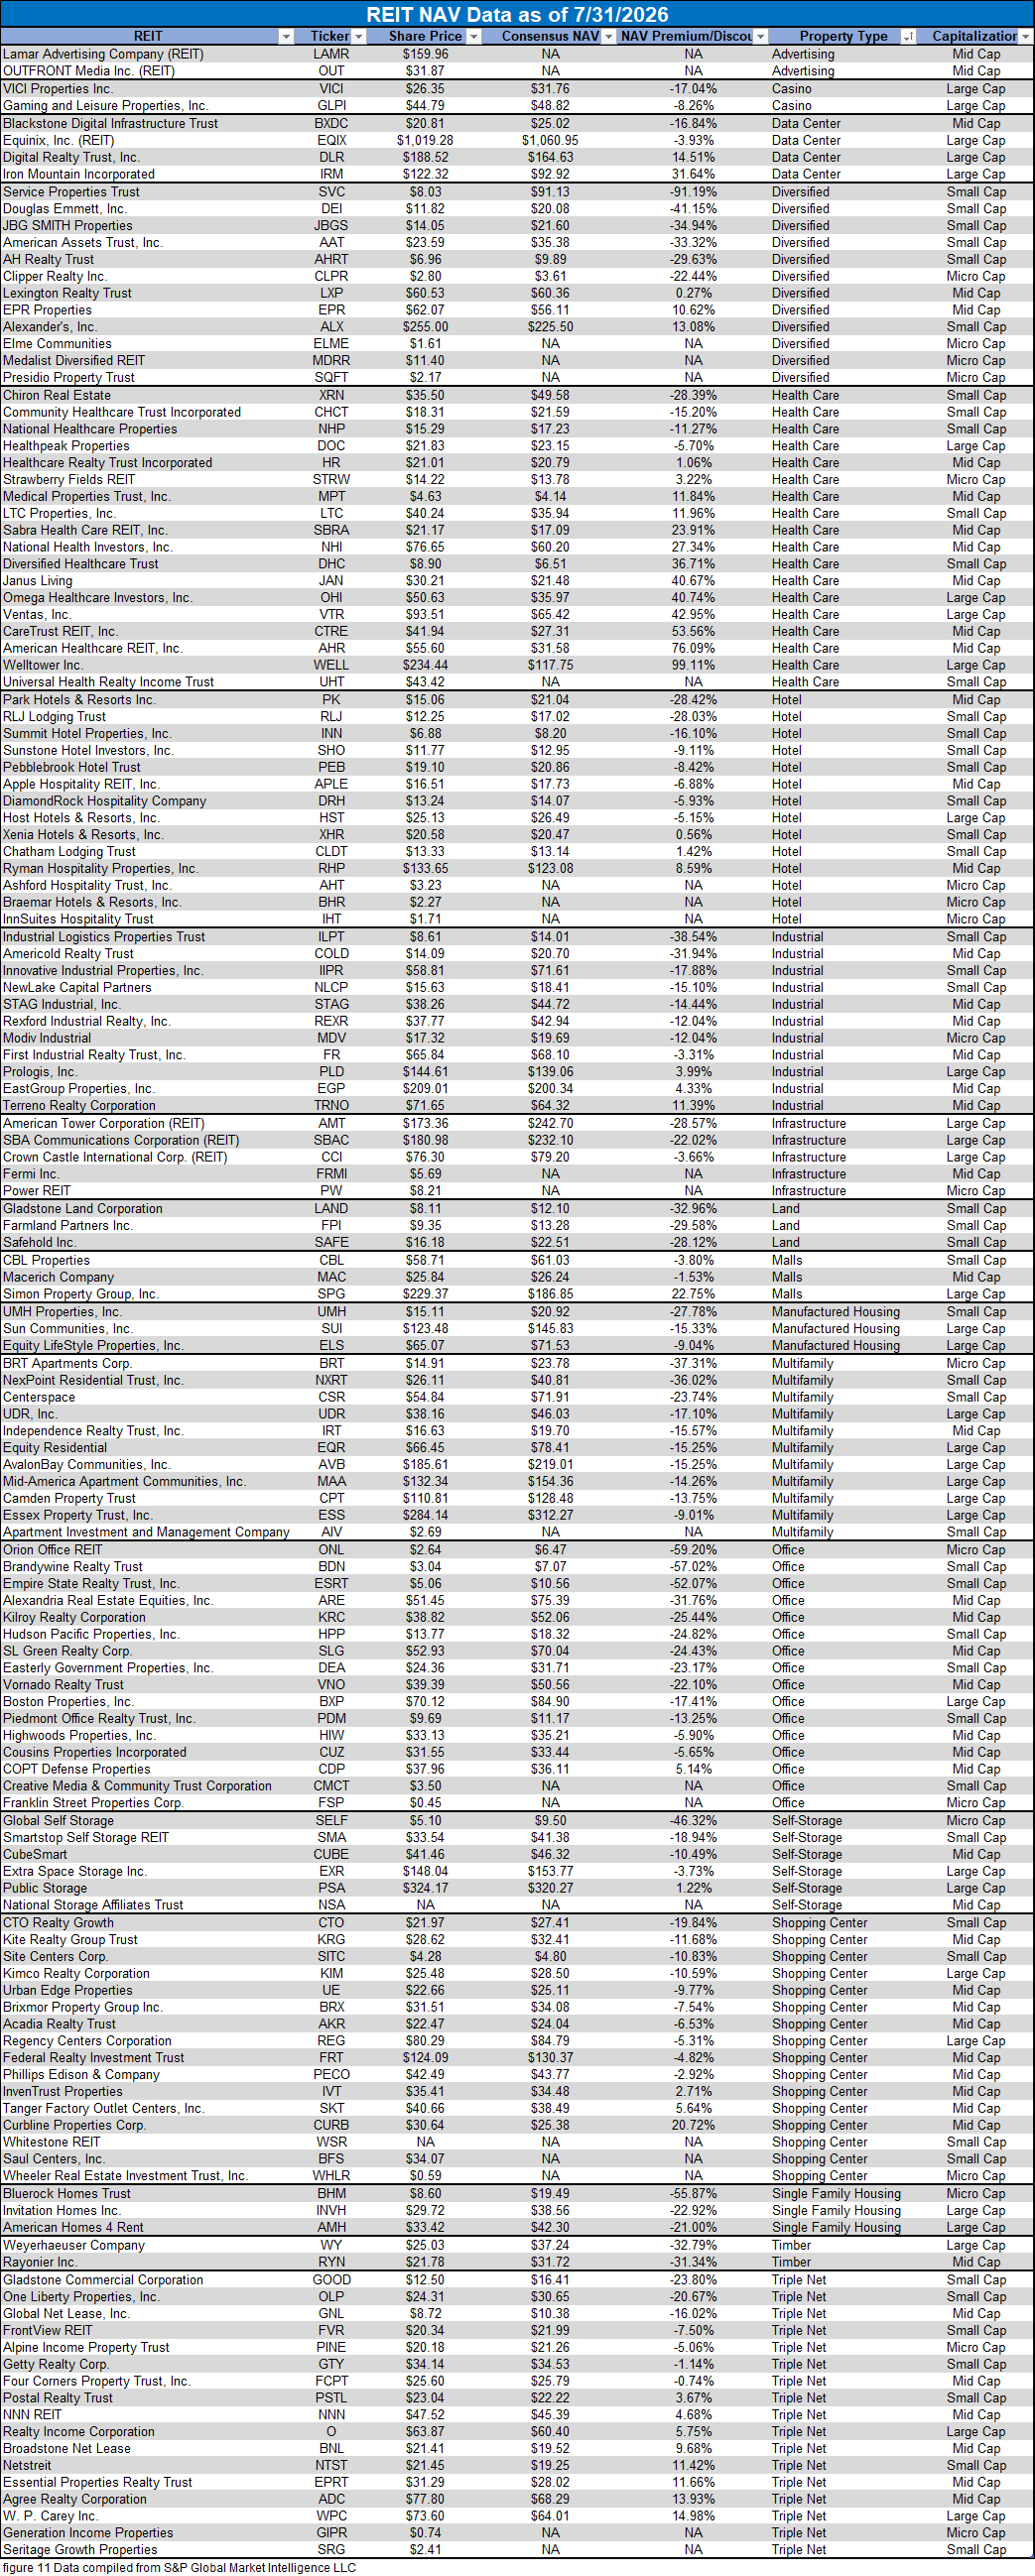
Below is a downloadable data table, which ranks REITs within each property type from the largest discount to the largest premium to NAV. The consensus NAV used for this table is the average of analyst NAV estimates for each REIT. Both the NAV and the share price will change over time, so I will continue to include this table in upcoming issues of The State of REITs with updated consensus NAV estimates for each REIT for which such an estimate is available.
Takeaway
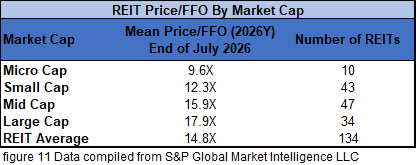
The large cap REIT premium (relative to small cap REITs) widened in July and investors are now paying on average about 46% more for each dollar of 2026 FFO/share to buy large cap REITs than small cap REITs (17.9x/12.3x – 1 = 45.5%). As can be seen in the table below, there is presently a strong positive correlation between market cap and FFO multiple.
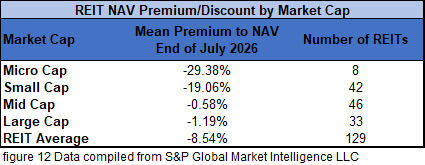
The table below shows the average NAV premium/discount of REITs of each market cap bucket. This data, much like the data for price/FFO, shows a strong, positive correlation between market cap and Price/NAV. The average large cap (-1.19%) and mid cap REITs (-0.58%) trade just shy of NAV. Small cap REITs (-19.06%) trade a little above 4/5 of NAV while micro caps (-29.38%) trade slightly below ¾ of NAV.
After Being Hit with Massive New Supply for Years, Multifamily Fundamentals Began to Recover During the First Half of 2026
The past few years have been tough for multifamily REITs as they have had to deal with an enormous wave of new completions that shifted supply/demand dynamics in an unfavorable direction. Thankfully, however, demand growth has been more robust than many feared, which softened the pain but still left many multifamily landlords offering much bigger concessions to tenants than in years past. The first two quarters of 2026, however, suggest that a multifamily recovery is now underway.
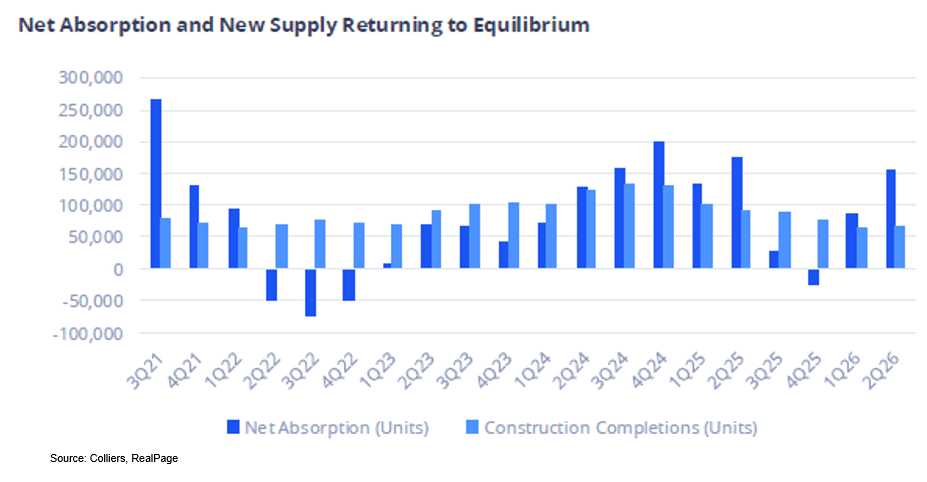
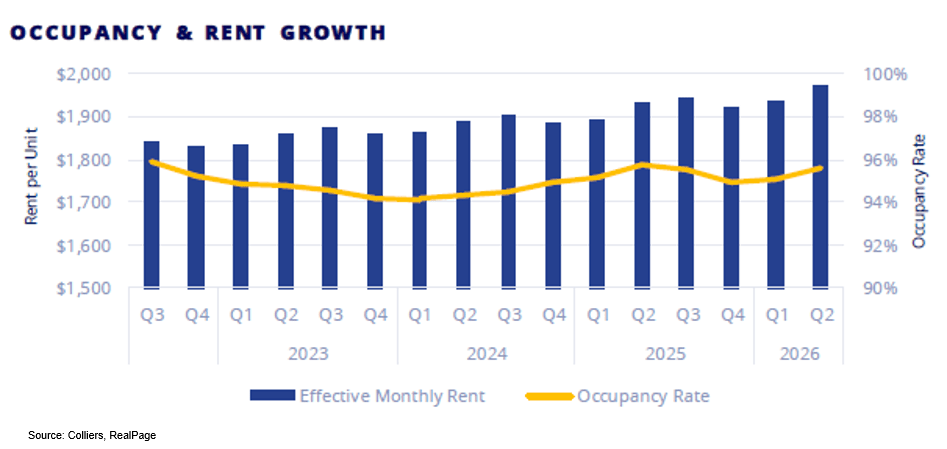
After weak net absorption in Q3 2025 that actually turned negative in Q4 2025, demand recovered sharply in Q1 2026. Net absorption then accelerated in Q2 2026 with 152,856 units, which was 2.3x the 67,268 units delivered. With demand reaccelerating as completions moderate, multifamily landlords have been able to achieve gains in both effective rent and occupancy in each of the past 2 quarters.
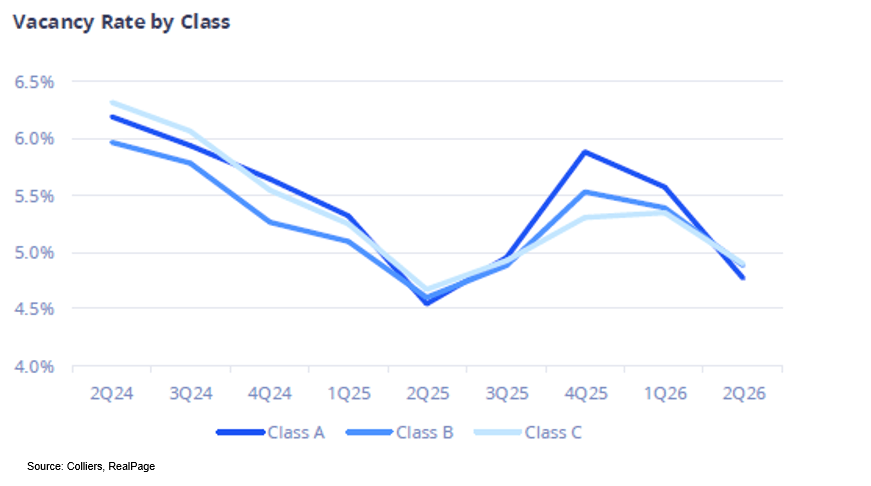
The favorable shift in supply/demand fundamentals fueled a strong decline in vacancy rates for Class A, Class B and Class C properties during the first half of 2026. Class A multifamily saw a particularly sharp improvement in vacancy falling from nearly 6% at the end of 2025 down to less than 5% by the end of Q2 2026.
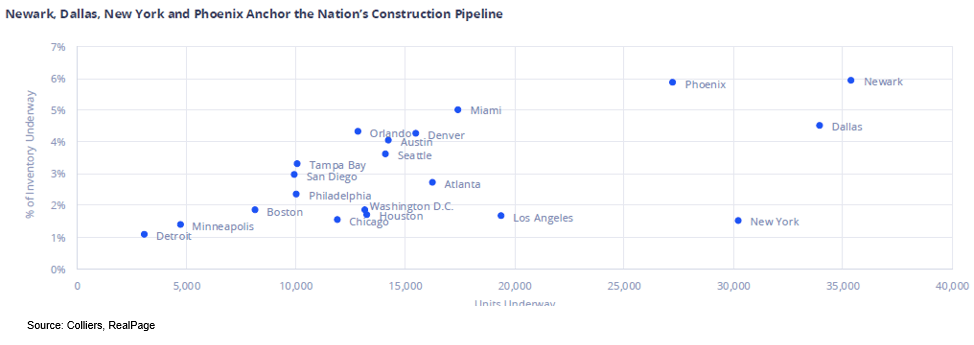
The supply wave isn’t entirely in the past though as there are still another 498,090 units under construction. As can be seen in the graphic below, some markets will be hit far harder by incoming supply than others. The number of units in the construction pipeline in Newark, Phoenix and Miami exceeds 5% of existing inventory.
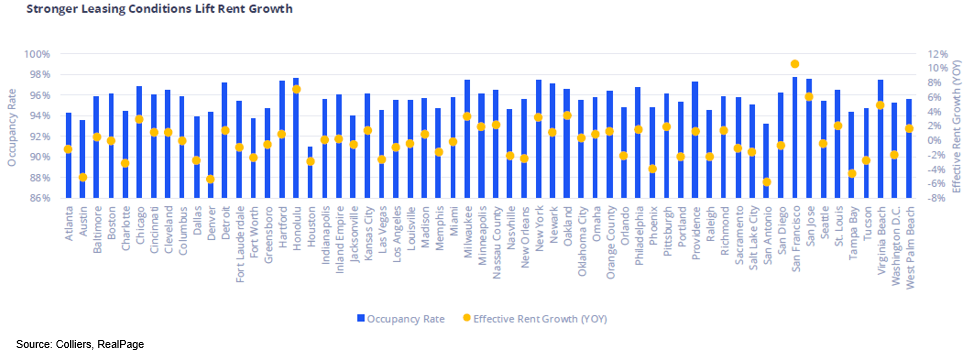
Due to very disparate impact from the recent supply wave, which hit the Sunbelt far harder than the Midwest, West Coast or Northeast, current occupancy rates and effective rent growth differ wildly by market. San Francisco is seeing double-digit effective rent growth while San Antonio, Denver and Austin are still in the red.
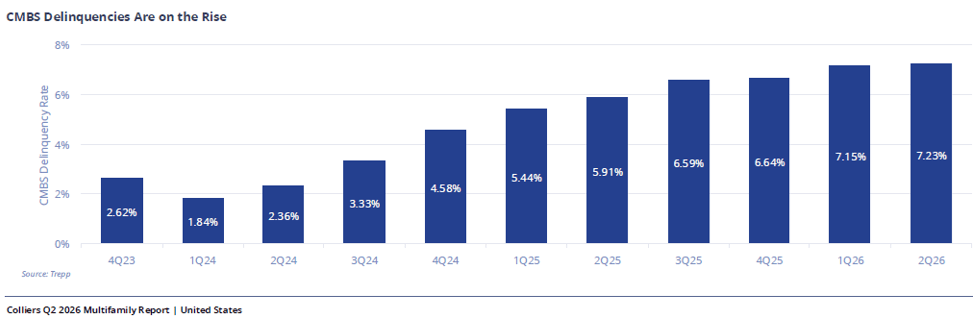
Despite strong overall improvement over the first half of 2026, however, not all multifamily is recovering. The CMBS delinquency rate has increased 9 quarters in a row and is 59 basis points higher than it was at the start of the year. REITs generally have far better balance sheets than most of their private sector peers, but the continued rise in delinquencies is still a concerning trend that needs to be closely monitored.
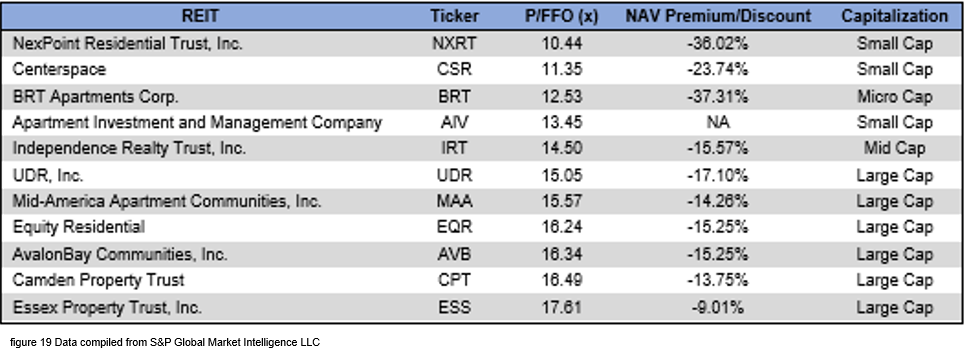
Multifamily REIT valuation varies widely and there is currently a substantial large cap multiple premium. All large cap multifamily REITs currently trade at greater than 15X FFO multiples, while small caps trade as low as 10.44x for NexPoint Residential Trust (NXRT) or 11.35x for Centerspace (CSR).
While the improvement in multifamily fundamentals over the first half of the year is encouraging, there are significant differences by market, and not every MSA is recovering yet. Additionally, multifamily REITs differ greatly in portfolio geography, strategy, and balance sheet strength, providing investors with a variety of ways to invest in the sector that carry very real differences in upside potential as well as risks. It is an interesting point in the multifamily real estate cycle, and investors would be wise to do thorough due diligence on each REIT in the sector before investing.
Important Notes and Disclosure
All articles are published and provided as an information source for investors capable of making their own investment decisions. None of the information offered should be construed to be advice or a recommendation that any particular security, portfolio of securities, transaction, or investment strategy is suitable for any specific person. The information offered is impersonal and not tailored to the investment needs of any specific person.
We cannot determine whether the content of any article or recommendation is appropriate for any specific person. Readers should contact their financial professional to discuss the suitability of any of the strategies or holdings before implementation in their portfolio. Research and information are provided for informational purposes only and are not intended for trading purposes. NEVER make an investment decision based solely on the information provided in our articles.
We may hold, purchase, or sell positions in securities mentioned in our articles and will not disclose this information to subscribers, nor the time the positions in the securities were acquired. We may liquidate shares in profiled companies at any time without notice. We may also take positions inconsistent with the information and views expressed on our website.
We routinely own and trade the same securities purchased or sold for advisory clients of 2MCAC. This circumstance is communicated to our clients on an ongoing basis. As fiduciaries, we prioritize our clients’ interests above those of our corporate and personal accounts to avoid conflict and adverse selection in trading these commonly held interests.
Past performance does not guarantee future results. Investing in publicly held securities is speculative and involves risk, including the possible loss of principal. Historical returns should not be used as the primary basis for investment decisions. Although the statements of fact and data in this report have been obtained from sources believed to be reliable, 2MCAC does not guarantee their accuracy and assumes no liability or responsibility for any omissions/errors
Commentary may contain forward-looking statements that are by definition uncertain. Actual results may differ materially from our forecasts or estimations, and 2MCAC and its affiliates cannot be held liable for the use of and reliance upon the opinions, estimates, forecasts, and findings in this article.
Through October 2021, The State of REITs was published exclusively on Seeking Alpha by Simon Bowler, Sector Analyst at 2nd Market Capital Services Corporation (2MCSC). Editions subsequent to October 2021 will be published on this website in addition to other platforms that may include Seeking Alpha. 2MCSC was formed in 1989 and provides investment research and consulting services to 2nd Market Capital Advisory Corporation. 2MCSC does not provide investment advice. 2MCSC is a separate entity but related under common ownership to 2nd Market Capital Advisory (2MCAC), a Wisconsin registered investment advisor. Simon Bowler is an investment advisor representative of 2MCAC. Any positive comments made by others should not be construed as an endorsement of the author's abilities to act as an investment advisor.
S&P disclosure: S&P Global Market Intelligence LLC. Contains copyrighted material distributed under license from S&P.
Discover more from 2nd Market Capital Advisory Corp
Subscribe to get the latest posts sent to your email.